
Investigation of Surface Deformation in Lower Jehlum Valley and Eastern Potwar using SRTM DEM
Maria Firdous1, Asma Ali2, Muhammad Usman Tanveer3, Rao Kamran Munawar4, Saif-ul-Rehman5, Iqra Aslam5, Ghafar Tanveer4, Syed Amir Mahmood1
1: Department of space science
2: Geography Department Kinnaird College for Women, Lahore
3: Punjab university Lahore
4: Institute of Management sciences Lahore
5: Department of Geography. GC University, Lahore. *Correspondence | Maria Firdous Email: mariafirdous1122@gmail.com Citation | Firdous M, Ali A, Tanveer M.U, Munawar R.K, Rehman U. S, Aslam. I, Tanveer G, Mahmood S.A. “Investigation of Surface Deformation in Lower Jehlum Valley and Eastern Potwar using SRTM DEM”. International Journal of Innovations in Science and Technology, Vol 02 Issue 01: pp 17-30. DOI: https://doi.org/10.33411/IJIST/2020020102 Received | December 01, 2019; Revised | December 23, 2019; Accepted | December 25, 2019; Published | January 03, 2020 ___________________________________________________________________
Abstract:
This study describes the surface deformation in lower Jehlum and eastern Potwar using remotely sensed Shutter Radar Topographic Mission (SRTM) Digital Elevation Model (DEM) to identify regional uplift rates. Mapping of active surface deformations help to predict seismic hazards. DEMs are the fundamental input factors that identify the surface geometry and its belongings. These belongings include stream offset, elevation, and slope breaks within a contributing area. This study provides an evidence of tectonic activity and its impact on regional drainage network using SRTM DEM. Various indices including concavity and steepness were computed using power law in steady state conditions. We prepared the drainage network map of the study site showing uplift rates in mm/year. The deflection in stream network proves the existence of active fault in this region which controls the local drainage network. The results prove the relative uplift along Main Boundary Thurst (MBT) and the impact of active tectonic on evolving young organs.
Keywords: SRTM, DEM, MBT, Indices Power Law, Deformations
Introduction:
The controls on tectonic structures in a hilly area are technically sound regarding horizontal translations, rock uplift, bed rock erosion, climatic variations and the development of incised structures [1]. River pattern demonstrates multiple forces in action e.g. river geometry is useful to identify the spatial patterns of uplift in various cases [2]. Longitudinal river profile can retort to climate by erosional and hydrological situations and also affected by orographic precipitations [3,4].
Lithology is a fundamental element which defines the concavity of the river [5]. Lithology of a river describes the rate of erosion and incision. This study describes the neo-tectonics in the investigation site e.g. faults in eastern Potwar and the stream interactions. It is based on remotely sensed analysis of tectonic activity and its impacts on regional surface deformations. Digital Elevation Model (DEM) is used here to define the surface geometry in details.
Tectonic movement along fault is characterized by various features including stream offset, elevation, moraines, landslides, slope breaks, fluvial terraces and the drainage zone. We performed the stream profile analysis to compute surface deformation in the study site. Stream analysis is important to draw stream network and their characteristics in the study site. This analysis is useful to study tectonic activity indirectly.
This study aim at computing steepness, and concavity which is helpful to compute the uplift rates. It also aims at investigating the impacts of Muzaffarabad earthquake 2005 in Pakistan.
Study Site and Tectonic Settings
The study site lies between 73-74E longitude and 33-34N latitude. A part of Main Boundary Thurst (MBT) is lying underneath the study site in the northwest direction. Various structural styles are located underneath the study site e.g. Riasi and
Kotli Thurst is in SE-NW oriented and the Jehlum fault is also in the same orientation. Another fault “Rawat” is oriented in SW-NE direction. The lineaments and out crops are right angle to the direction of transportation at a rate of 17-19 mm/year [6]. The study site is mapped in the figure 1:
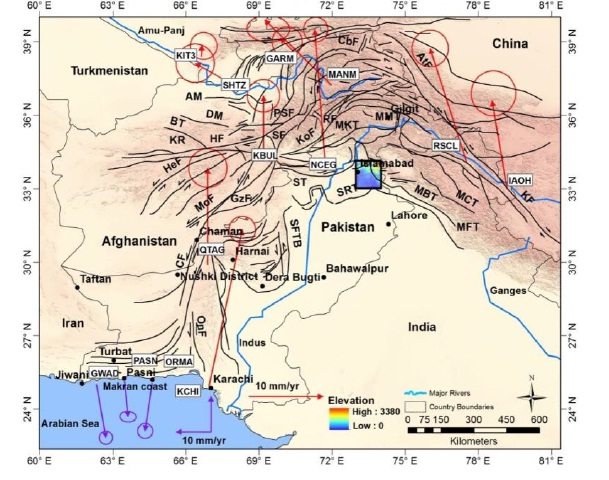
Fig.1 Tectonic map of the Hindu Kush-Himalaya-Pamirs-Karakoram showing reported and newly confirmed faults with inset showing the study area.
Figure 2 is showing that topography is more heave in NE part in comparison to southern part.
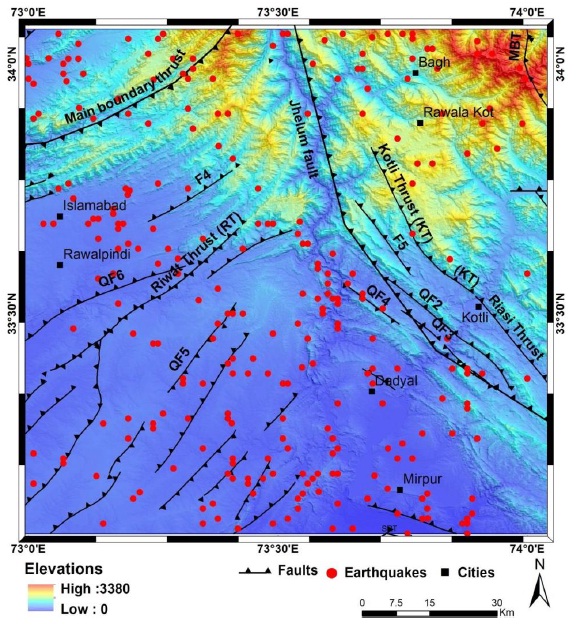
Fig.2. Location of study area with earthquakes locations in red and thick black lines represent thrust faulting with teeth symbols showing direction of thrust movements.
Data and Methods
SRTM Digital elevation model (DEM) is used in this study to extract drainage network and to compute steepness, slope, and concavity.
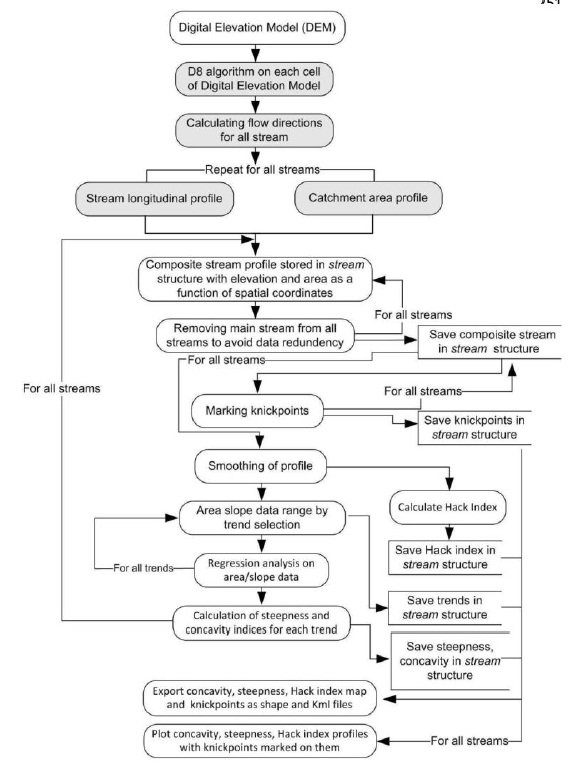
Fig.3 Flow chart showing various algorithms implemented during SRTM DEM processing.
DEM based Drainage Extractions
D8 algorithm is commonly and mostly used algorithm to compute flow direction, accumulation, stream definition, stream segmentations, catchment grid delineation, catchment polygon processing and the drainage line processing. A depression less DEM is required as basic input to compute the flow direction. We used the built-in utility in Arc GIS 10.1. “Fill” to generate a depression DEM. This algorithm check depressions pixel by pixel and fill them by interpolating nearby pixel. To compute “flow direction”, the elevation of central cell is compared with its eight surrounding cells and the direction leads to the cell having lowest elevation. In the proceeding step, flow is accumulated to define streams. The density of streams in drainage network is defined depending upon user’s requirement. If user need high stream density, a small number of cells is given in input and vice versa. In the next step, streams are segmented by connecting points to define the stream order. The stream order is useful to compute catchments areas and to draw drainage network in vector format. The river was demarcated in the drainage network using river tool 2.4.
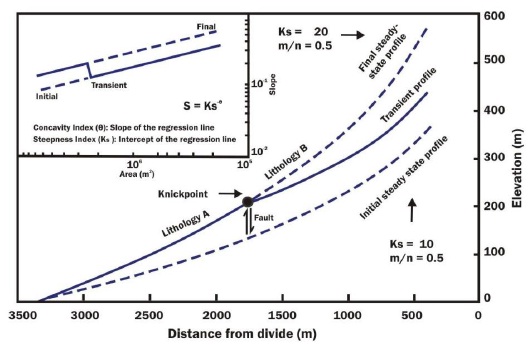
Figure 4. The diagram showing mechanism of River profile development, modified from Snyder et al (2000).
Concavity and Steepness Indices
In a diverse topography, the DEM shows scaling, where the stream’s slope is expressed by a function of Stream power law (SPL) [7,8] which is defined with formula as below ????=???????? ????−????
Where A is the drainage area of upstream, ???? and ???????? are concavity and steepness indices respectively, and “s” is the slope of particular channel. Index of concavity (IOC) is represented by????.
Results and Discussion
A consistency was not observed in stream river channels due to diverse neo-tectonic activities in NE and NNE parts of the study site. The pattern of spatially distributed stream channels represents local deviations in thurst belts. The information of stream profiles had detailed information of neo-tectonics signals.
The inconsistency in drainage profiles demonstrates the variation in uplift rates in the study site. As shown in figure 5.
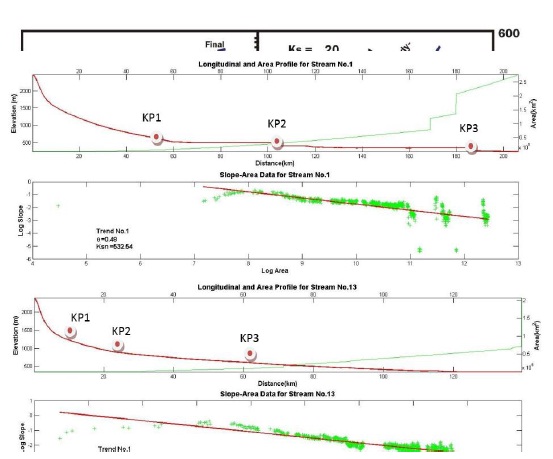
Figure 5. River profile analysis for the Jhelum and Poonch Rivers, three knickpoints are identifiable.
In a watercourse, a change within two index of steepness (IOS) is generally connected by a higher or lower index of concavity (IOC) value. However, IOC is comparable to early and ultimate profiles of drainage network [9]. The lower value of IOC describes the variability in rock strength. The degree of roughness in knick point, describes the tectonic events, and lithological disparity or stream capture events.
A sharp knick zone is an indication of most recent tectonic activity [10]. The stream no: 1 in figure 5 of Jehlum river profile shows the IOS value=532.54 and IOC=0.48. These values define that area corresponding to stream 1 is less eroded and is in uplifting process. KP1 describes Kotli Thurst (KT), KP2 represents Quaternary Fault (QF2), and KP3 indicates the interaction of Ponch river with Quaternary Fault (QF3). KP1 and KP2 is related to intersection of Jehlum Fault (JF) with Jehlum River KP3 is under the influence of QF3 in north of Mirpur which proves that Jehlum River is under the influence of JF.
The sudden variations in geomorphic expressions of stream profiles describes variations in horizontal or vertical tectonic movements in lithological contrasts, high values of Hack Gradient Index (HGI) were observed in NE and NW part of the study site as shown in figure 6, because IOS values are in direct relation to Relative Uplift Rates (RURs).
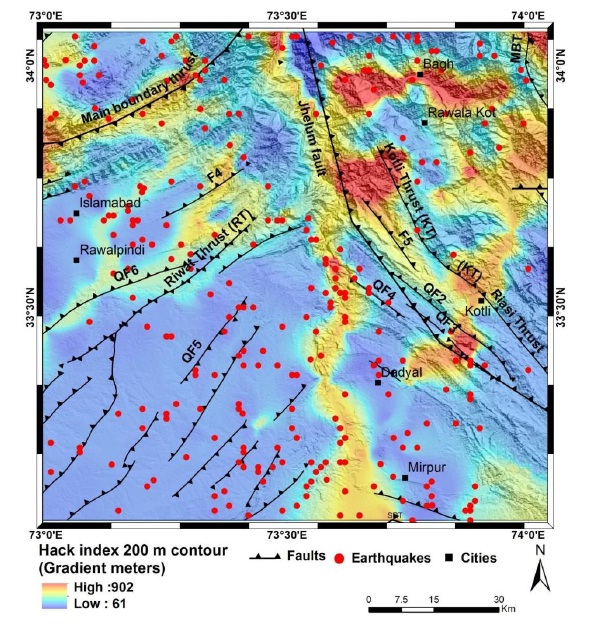
Fig.6. The interpolated Hack SL-gradient map for the study area.
We extracted 109 streams using SRTM DEM and computed IOS and IOC values as shown in figure 7 and figure 8 and applied geomorphic indices using stream power law (SPL) to all streams.
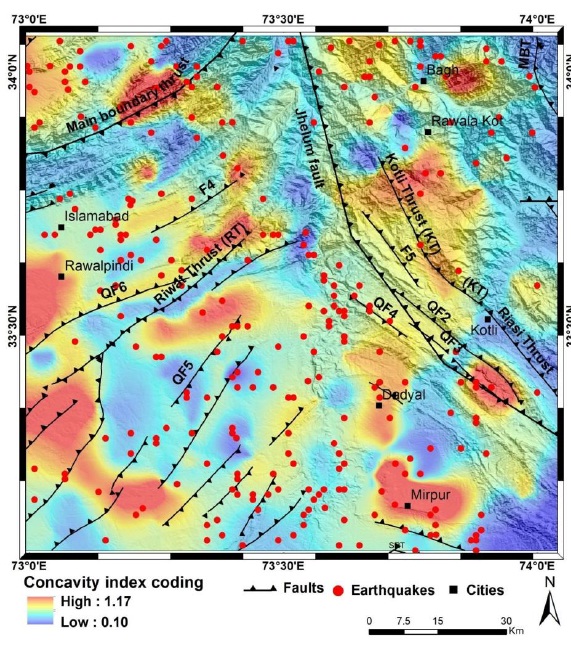
Figure 7. The interpolated IOC map of the study area.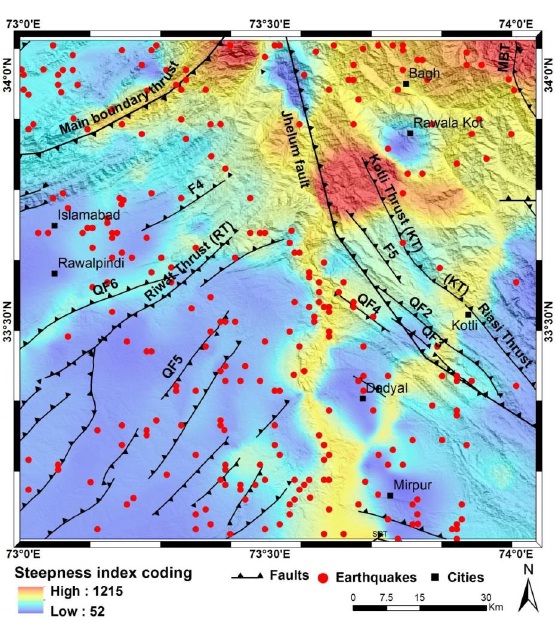
Figure 8. The interpolated IOS map of the study area
A relative uplift note map was generated for the study site in Mat lab environment. The RUR map show a diversity in uplift rates in various parts of the study site.
RURs is between 0.53-1.21 mm/year in NNE of the study site while RURs were observed between 0.05-0.51 mm/year as shown in figure 9. These rates were between 0.06-0.36 mm/year in the southern section.
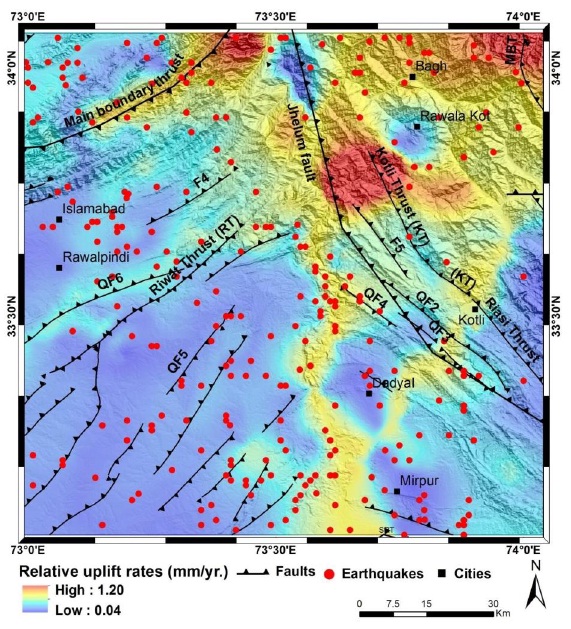
Figure 9. Map showing RURs of the study area.
These rates clearly describe that the NNE region of study site is more uplifted in comparison to SW part.
The highest value of RURs was observed near to MBT between JF and KT. This research indicates that the flow direction and the orientations of streams is influenced by local and regional faults.
Most of Jehlum River is controlled by JF and some of its path is under lithological control which again run under Mangla fault upto Mangla reseruior. Local and lineaments are responsible for growth and development of spatial drainage distribution at local scale.
Conclusion
The automated drainage network extracted using SRTM DEM is significant to investigate SPL which provides information regarding active surface deformation and the topographic development in a study site. Geomorphic indices of Poonch and Jehlum River are important to examine the surface activity across a study area. This study reveals that geomorphometric features are effective indicator to study neo-tectonics in young topographies with variable uplift rates.
Reference
1. Chen, S. P., Qi, J. F., Cheng, X. S., Xu, Z. Q., Xie, C., Zhao, Y. B., & Sun, H. L. (2006). Category of fault block group in rift basin: Example from Dongpu depression. Fault-block Oil & Gas Field, Vol.13, No.3, pp. 1-5
2. Whipple, K.X, and Tucker, G.E., 2002, Implications of sediment-flux dependent river incision models for landscape evolution: Journal of Geophysical Research, v. 107, no. B2, 20 p., doi: 10.1029/2000JB000044
3. Roe, G.H., Montgomery, D.R., and Hallet, B., 2002, Effects of orographic precipitation variations on the concavity of steady-state river profiles: Geology, v. 30, p. 143–146, doi: 10.1130/0091-7613(2002)030<0143: EOOPVO>2.0.CO; 2.
4. Stock, J. D., and D. R. Montgomery (1999), Geologic constraints on bedrock river incision using the stream power law, J. Geophys. Res., 104, 4983 – 4993.
5. Duvall, A., Kirby, E., and Burbank, D.W., 2004, Tectonic and lithologic controls on channel profiles and processes in coastal California: Journal of Geophysical Research, v. 109, p. F3, doi:10.1029/2003JF000086.
6. Jadoon, I. A. I<, Frisch, W., Kemal, A. & Jaswal. T. M., 1997 (in press). Thrust geometries and kinematics in the Himalayan foreland (North Potwar Deformed Zone), North Pakistan Geol. Rundschau 200.
7. Howard, A.D., and Kerby, G., 1983, Channel changes in badlands: Geological Society of America Bulletin, v. 94, p. 739–752, doi: 10.1130/0016-7606(1983)94<739: CCIB>2.0.CO;2
8. Hack, J.T., 1973, Stream profile analysis and stream-gradient index: U.S. Geological Survey Journal of 195 Research, v. 1, no. 4, p. 421–429
9. Wobus, C., Whipple., K. Kirby, E., Snyder, N., Johnson, J., Spyropolou, K., Crosby, B. and Sheehan, D. (2006). Tectonics from topography: Procedures, promise and pitfalls. In: Willett, S.D., Hovius, N, Brandon, M.T., and Fisher, D.M., eds., Tectonics, Climate and Landscape Evolution. Geological Society of America Special Paper, 398: 55-74
10. Sklar, L. S., and W. E. Dietrich (2001), Sediment and rock strength controls on river incision into bedrock, Geology, 29, 1087 – 1090.


