
Monitoring the Spatial Structure of land values in Lahore Metropolitan area
Ayesha Khalid1*, Khadija Waheed 1 and Shams Ur Rehman1
1 Govt College University, Lahore.
* Correspondence: Ayesha Khalid: ayeshakhalid554@gmail.com
Citation| Khalid.A, Waheed.K and Rehman.S “Monitoring Spatial Structure of land values in Lahore Metropolitan area”. International Journal of Innovations in Science & Technology, Vol 02 Issue 04: pp 181-194, 2020.
Received |Dec 01, 2020; Revised | Dec 14, 2020; Accepted | Dec 15, 2020; Published | Dec 16, 2020.
________________________________________________________________________
Abstract.
Spatio-temporal variations in assessment of land values play a vital role in better urban planning and policy making. This study focuses on spatial structures of land values in Lahore metropolitan area by using different spatial and statistical techniques. The comparative analysis of land values for the years 2012 & 2018 is generated which is useful for planners, investors, and policy makers. The research is descriptive but explanatory in nature to show correlation between independent variables (real land values) and dependent variables (interpolated land values). The interpolation techniques which have the highest correlation coefficient, were used further processing. The inter category shift based on interpolation maps for comparison shows categorical shift which is useful for investors in future. The results indicate that the land values are higher in Central Business District and Gulberg Zone because of highly active business zone which increases the demand of the land which is ultimately increasing the value of land in Lahore metropolitan area.
Keywords: Land values per Marla; Central Business District Lahore; Accuracy Assessment; Correlation Coefficient and Interpolation.
Introduction
Urban land values are an important aspect of urban geography where emphasis is on spatial structures. Land values are not uniformly distributed, the variability exist over space. The land values are lower at periphery as we move away from Central Business District (CBD) [1]. Due to lack of public transportation network and great distance from main CBD, mostly people do not buy land for residence in suburb areas but only those who can afford transportation cost, live at periphery so the land values remain lower at the edges and congestion occur near center which ultimately trigger issues like environmental degradation in form of pollution [2]. To avoid such variability in land values, a proper monitoring mechanism is required for better planning and future investments [1, 2]. The spatial structures of land values are linked with the urban development where the development is more the land values are higher. Spatio-temporal assessment of land values is helpful for planners, policy makers and investors for better understanding and planning of future to make plans and policies to avoid issues and problems [3, 4].
Land prices are important aspect of urban area which needs to be monitored properly. To examine the variability in land prices over space, the spatio-statistical techniques are applied by incorporating real time land prices [5, 6]. The price of residential area differs from commercial areas because people acquire commercial land to perform economic activities [7, 8].
The emphasis of the study is to map spatial structures of land values in Lahore metropolitan city through GIS and statistical techniques. The study compares the data of years 2012 and 2018 using different geographical and statistical techniques (correlation coefficient).
Materials and methods
Investigation site.
Lahore is one of the largest cities of Pakistan and capital of province Punjab. It is located in northeast of Punjab which extends from 31° 15' and 31° 43' Northern latitude and 74° 10' and 74° 39' East longitude with 1772 Sq Kms total area. Lahore falls into a major climatic zone which is Sub-Tropical continental lowlands which face high summer temperature and receive late summer monsoon rainfall. It has a semi-arid type of climate. Lahore has an alluvial plain traversed by river Ravi [9].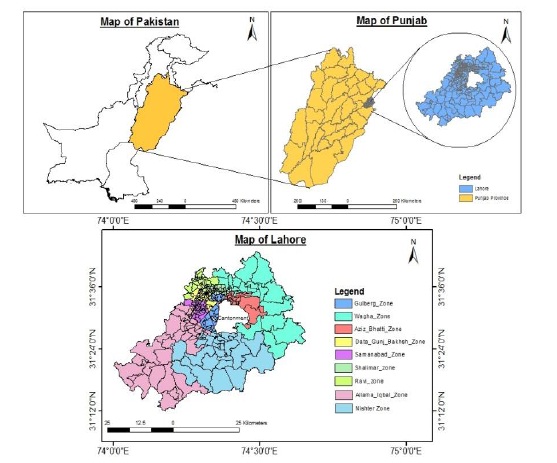
Figure 1. Study site
Lahore has one cantonment and nine zones which are Ravi, Shalimar, Gulberg, Data Gunj Bakhsh, Samanabad, Allama Iqbal, Nishter, Aziz Bhatti and Wagha. These zones are further divided in total 274 Union Councils. Lahore is the second most populous city of the country with 11 million heads [10]. The highest concentration of people found near or around the city center. Lahore is famous for its commercial activities and is considered as active business zone which attracts many people from different parts of country [9]. The spatial extent of study site is mapped in Figure 1.
The number of localities were different for the both residential and commercial areas. Total number of residential areas in 2012 were 917 that increased to 1191 in 2018 which shows 23% increase. Total number of commercial areas in 2012 were 1004 that increased up to 1287 in 2018 which shows 22% increase [11, 12]. Most of the development was observed in southeast and southwest of Lahore and remarkable development was observed in Wagha zone in north of the city.
Table 1. No of localities of Lahore metropolitan area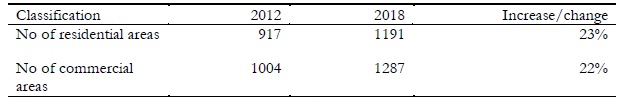

Figure 2. Residential areas of Lahore metropolitan area.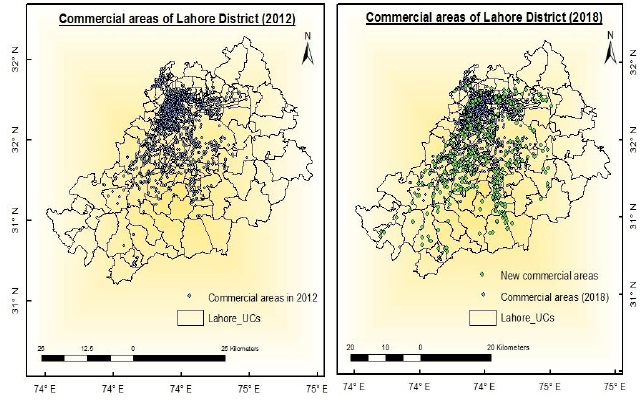
Figure 3. Commercial areas of Lahore metropolitan area.
Material and methods.
The study is based on secondary and descriptive approach. The data of land values was collected from Senior Member Board of Revenue, Lahore (SMBR) and DC office Lahore. The shape files for spatial analysis were acquired from Urban Unit Lahore. ArcGIS 10.3 version was used for spatio-statistical analysis [10, 11, 12].
After collection of land values record, the data is extracted in excel along with GPS points for further processing. Excel sheets are converted into shape files in ArcGIS 10.3 to perform spatial analysis e.g., application of interpolation techniques. The validation results were converted to excel sheet from attribute table to find correlation coefficient. To check inter category change, the counter change and growth rate was calculated.
Various interpolation techniques were used including Inverse Distance Weightage (IDW), Kriging available in ArcGIS 10.3 interface. Correlation is one of the useful statistical techniques to find association between two variables. The correlation coefficient ranges between -1 to +1, where a value of “0” shows that there exists no relation between variables. If the value is greater than 0, it means that variables are positively correlated and vice versa. In this study two variables are used which are interpolated land values (dependent variable) and true land values (Independent variable).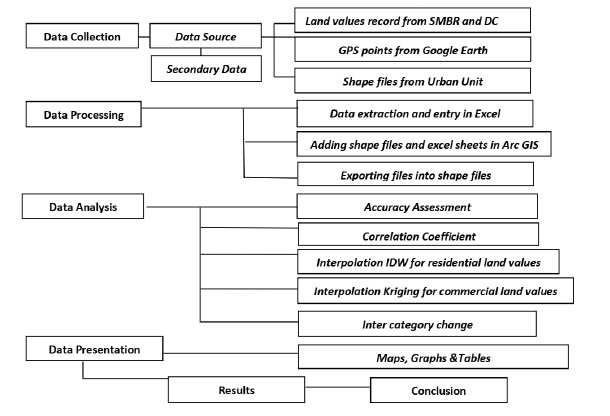
Figure 4. Flow of Methodology
IDW is used for residential land values and Kriging is used for commercial land values on the basis of correlation results. For comparison of land values for the years 2012 and 2018, the inter category change of areas in map were also calculated by using counter check and applying growth rate formula to check the change over time in percentage. The inter category shift is further helpful for investors and planners. To present data in meaningful form, different maps, and tables were generated in excel and ArcGIS.
Results and discussion.
Validation results of IDW & Kriging were further used to find correlation between interpolated values and true values. In case of residential land values, the more accurate result of correlation coefficient is found for IDW technique which has positive coefficient of 0.74222 values that shows moderate relation in variables for the year 2012 and found positive coefficient 0.742276 for the year 2018. However, for Kriging technique, the correlation coefficient was 0.61057 for the year 2012 and 0.616911 for the year 2018.
R² in scatter plot known as Coefficient of Determination which shows how well trendline, more closer to 1 value indicates that trendline better fit. Scatter plot in figure 5 shows the relation of interpolated values with true values of 2012 by trend line which indicates the positive association of variables with 0.555 R² and scatter plot for 2018 indicates the positive association of variables with 0.551 R². The result shows that IDW technique is more correlated in case of residential land values and was further used to show spatial structure.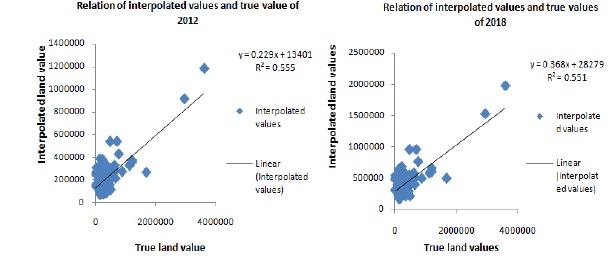
Figure 5. Scatter plot of validation result for Interpolation IDW techniques of residential areas.
In case of commercial land values, the result of correlation coefficient was more efficient for Kriging technique which shows a positive coefficient with 0.725266 for the year 2012 and also a positive correlation coefficient 0.72298 for the year 2018. The IDW generated correlation value was 0.634233 for 2012 and 0.636146 for 2018. It shows that Krigging technique is more correlated in case of commercial land values.
Scatter plot was used to highlight the relationship of interpolated values with true values of 2012 by trend line which indicates the positive association of variables with R² = 0.528 and in 2018 result shows the positive association of variables with R² = 0.522. It shows that Krigging technique was more correlated in case of commercial land values and was further used to show spatial structure.
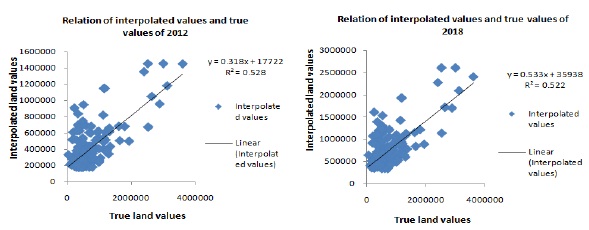
Figure 6. Scatter plot of validation result for Interpolation Krigging technique of commercial areas.
The highest residential land value found in city center which is known as walled city because it is the main CBD of Lahore. According to bid rent theory, the land values are highest in the CBD as we move away these values start declining. The changes are mentioned in Figure 7

Figure 7. Spatial structure of residential land values in Lahore metropolitan area.
Residential land values were observed ranging from 0.15 to 1 million rupees per Marla with lowest amount found near periphery in 2012. Comparative result in map shows that in 2012 most of land area was under the range of 0.15 to 0.3 million rupees and in city center, the prices were from 0.3 to 1 million rupees. But in 2018, most of the land area of city was found under the range of 0.3 million rupees to 0.5 million rupees and in city center it was from 0.5 million rupees to more than 1 million rupees.
Inter category shift was calculated to compare the values of 2012 and 2018. In case of residential land values, the highest shift of areas was found in three ranges. The highest shift was observed in category of the third range 0.75 to 1 million rupees where there were only 5 regions existing in 2012 which exceeded to 34 showing 85% growth rate. The lowest growth rate was found within the range of 1 million or more which is showing the growth rate of about 49% and negative rate observes over the ranges of less than 0.15 to 0.3 million.
Table 2. Inter category shift of residential land values from 2012 to 2018.

Figure 8. Inter category change in residential land values from 2012 to 2018.
Average residential land values of different zones show that the highest land values were in Ravi zone and Gulberg Zone which were 0.4 million rupees in 2012 and 0.7 million rupees in 2018 for commercial areas. The lowest average land value were found in Wagha zone which was 0.1 million rupees in 2012 and 0.2 million rupees in 2018. The result of average land values shows that the increase in land values from 2012 to 2018 was gradual in all over the zones.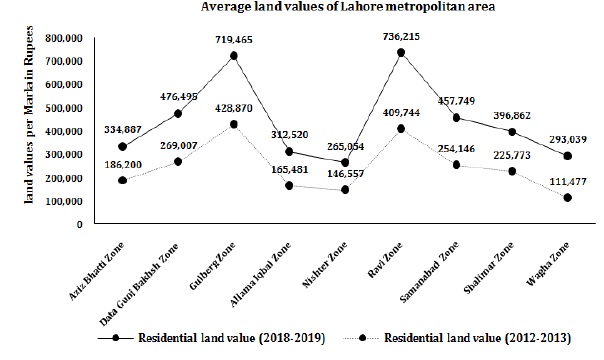
Figure 9. Average residential land values of Lahore Zones from 2012 to 2018.
The highest commercial land value were found in city center which was the main CBD of Lahore. Commercial land values ranged from less than 0.25 million rupees to more than 1 million rupees per Marla. The lowest amount was observed in outer parts of Lahore mostly in Wagha and Nishter town. Comparative result shows that in 2012, most of the area was under the range of less than 0.25 million rupees to 0.5 million rupees and the highest amount was found in Ravi and Gulberg zone which had more than 1 million rupees. In comparison to 2018, most of the area was observed under the range of 0.25 million rupees to 0.75 million rupees and the highest commercial land values were found in four zones of Lahore which are Gulberg zone, Ravi zone, Samanabad zone and Data Gunj Bakhsh zone where the land values were more than 1 million rupees.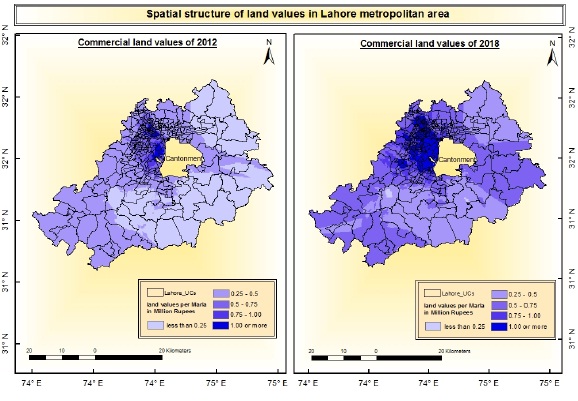
Figure 10. Spatial structure of commercial land values in Lahore metropolitan area.
The change in land values determines the rate of shift from 2012 to 2018. In case of commercial land values, the highest shift of areas was found in two ranges. First is 0.75 million rupees to 1 million rupees in which there were only 66 areas in 2012 and increased to 197 in 2018 having 66% growth rate. The second range was from 1 million rupees or more in which there were 108 areas in 2012 that increased to 344 areas which shows 69% growth. The lowest growth was found in the range of 0.5 million rupees to 0.75 million rupees which shows 4% growth and a negative rate was observes over the ranges of less than 0.25 million to 0.5 million rupees.
Table 3. Inter category shift of commercial land values from 2012 to 2018.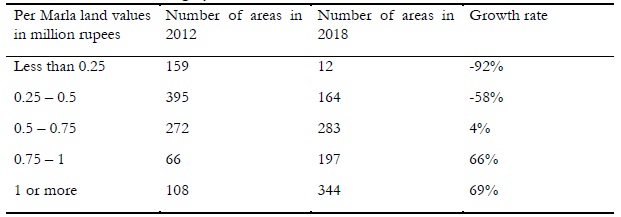
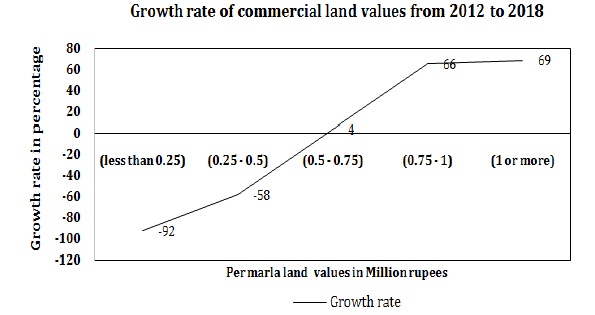
Figure 11. Inter category change in commercial land values from 2012 to 2018.
Average commercial land values of different zones show that the highest land values were in Gulberg Zone ranging between 0.9 million rupees in 2012 to 1.5 million rupees in 2018. The residential area was converted to commercial area. The lowest average land values were found in Wagha zone ranging between 0.1 million rupees in 2012 which increased to 0.4 million rupees in 2018 because of the less development in this zone.
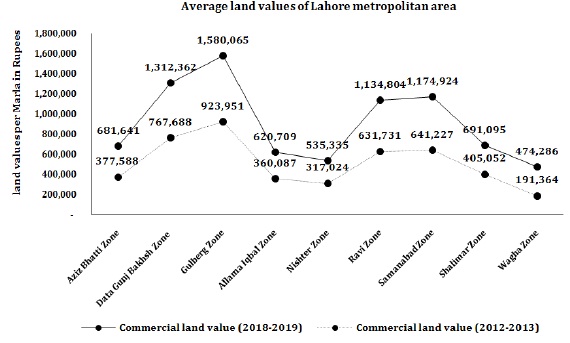
Figure 12. Average commercial land values of Lahore Zones from 2012 to 2018.
Conclusion.
This paper demonstrates the spatial structure of land values in Lahore metropolitan area by using different geographical and statistical techniques which will assist help planners, investors, and policy makers to manage a region in a better way. The results concludes that commercial land values were high for the four zones Ravi zone, Gulberg zone, Data Gunj Bakhsh zone and Samanabad zone because of the increasing commercial activities and development in Lahore. The land values were increased in the mid of city center and a considerable change was observed while applying spatial and statistical techniques.
Acknowledgement. The corresponding author would like to thanks Dr Ali Iqtadar Mirza (Department of Geography, Government College University Lahore) and Dr Shaker Mehmood (Department of Urban and Regional Planning, University of Engineering and Technology Lahore) for their intellectual guidance and support. The corresponding author is also indebted to Senior Member Board of Revenue Office, DC Office and Urban Unit Department for data sharing.
References
[1] Shamshad, A. (2004). Spatial distribution of land values in Karachi city (Doctoral dissertation, University of Karachi).
[2] Dziauddin, M. F., & Misran, M. (2016). Does Accessibility to the Central Business District (CBD) Have an Impact on High-Rise Condominium Price Gradient in Kuala Lumpur, Malaysia?. In SHS Web of Conferences (Vol. 23, p. 02004). EDP Sciences.
[3] Jordaan, A. C., Drost, B. E., & Makgata, M. A. (2004). Land value as a function of distance from the CBD: the case of the eastern suburbs of Pretoria. South African Journal of Economic and Management Sciences, 7(3), 532-541.
[4] Colwell, P. F., & Munneke, H. J. (2009). Directional land value gradients. The Journal of Real Estate Finance and Economics, 39(1), 1-23.
[5] Van Bergeijk, P. A., & Murshed, S. (2012). The relation between land price and distance to CBD in Bekasi. Master's thesis. Erasmus University, Rotterdam.
[6] Topccedil, M. (2009). Accessibility effect on urban land values. Scientific Research and Essays, 4(11), 1286-1291.
[7] Albouy, D., Ehrlich, G., & Shin, M. (2018). Metropolitan land values. Review of Economics and Statistics, 100(3), 454-466.
[8] Kahraman, E. D., & Kubat, A. S. (2015). In the effects of accessibility factors on land values in the CBD of Izmir. In Proceedings of the 10th international space syntax symposium (pp. 92-1)
[9] Mirza, A. I., Mayo, S. M., Aziz, A., & Sharif, M. B. (2013). Spatial-Temporal Variations of Nitrogen Dioxide in and Around Lahore Metropolitan Areas Using “GIS” Techniques. Pakistan Journal of Science, 65(3), 371.
International Journal of Innovations in Science & Technology
Sep2020 | Vol 2|Issue 3 Page | 93
[10] GOP The Urban Unit Lahore. Shape files of Lahore.
[11] GOP Deputy Commissioner Office (2019, March 14). Value of immoveable properties. Pakistan.
[12] GOP Fedral Senior Member Board of Revenue. (2018, December 18). Value of immoveable properties. Pakistan.
[13] Colwell, P. F., & Munneke, H. J. (1999). Land prices and land assembly in the CBD. The Journal of Real Estate Finance and Economics, 18(2), 163-180.
[14] Albouy, D., & Ehrlich, G. (2015, January). The distribution of urban land values: Evidence from market transactions. In Proceedings. Annual Conference on Taxation and Minutes of the Annual Meeting of the National Tax Association (Vol. 108, pp. 1-32). National Tax Association.
[15] Costello, G. (2014). Land price dynamics in a large Australian urban housing market. International journal of housing markets and analysis.
[16] Grimes, A., & Liang, Y. (2007). Spatial Determinants of Land Prices in Auckland: Does the metropolitan urban limit have an effect?. Available at SSRN 1005565.
[17] Hui, E. C., & Liang, C. (2016). Spatial spillover effect of urban landscape views on property price. Applied geography, 72, 26-35.
[18] Kim, J., & Zhang, M. (2005). Determining transit’s impact on Seoul commercial land values: An application of spatial econometrics. International Real Estate Review, 8(1), 1-26.
[19] Lee, Y. P. (2002). Determinants of Singapore residential land value (Doctoral dissertation, Massachusetts Institute of Technology).
[20] Ozus, E. (2009). Determinants of office rents in the Istanbul metropolitan area. European Planning Studies, 17(4), 621-633.
[21] Qin, Y., Zhu, H., & Zhu, R. (2016). Changes in the distribution of land prices in urban China during 2007–2012. Regional Science and Urban Economics, 57, 77-90.
[22] Rose, L. A. (1992). Land values and housing rents in urban Japan. Journal of Urban Economics, 31(2), 230-251.
[23] Sampathkumar, V., Santhi, M. H., & Vanjinathan, J. (2015). Forecasting the land price using statistical and neural network software. Procedia Computer Science, 57, 112-121.
[24] Thakur, S., & Choi, M. J. (2012). Characteristics of land value variation and the urban land market in Kathmandu, Nepal. International Journal of Urban Sciences, 16(1), 49-61.
[25] Wizor, C. H., & Arokoyu, S. B. Determinants of Land Value in the University of Port Harcourt Host Communities, Nigeria.


