
Non-invasive EEG based Feature Extraction framework for Major Depressive Disorder analysis
Nayab Bashir1, Sanam Narejo2, Bushra Naz2, Mohammad Moazzam Jawed2, ShahnawazTalpur2 ,Khurshid Aliev3
1 Department of Biomedical Engineering, Mehran University of Engineering and Technology, Jamshoro, Pakistan.
2 Department of Computer Systems, Mehran University of Engineering and Technology, Jamshoro, Pakistan.
3Department of Electronics and Telecommunication, Politecnico Di Torino, Italy,
*Correspondence: Nayab Bashir, Sanam Narejo, email, nabybashir@gmail.com, Sanam.narejo@faculty.muet.edu.pk.
Citation | Bashir. N, Narejo. S, Naz. B, Jawed. M. M, Talpur. S, Aliev. K, “Non-invasive EEG based Feature Extraction framework for Major Depressive Disorder analysis”. International Journal of Innovations in Science and Technology, Vol 4, Issue 1, pp 110-122, 2022.
Received | Jan 30, 2022; Revised | Feb 10, 2022 Accepted | Feb 11, 2022; Published |Feb 13, 2022.____________________________________________________________________
Depression and several other behavioral health disorders are serious public health concerns worldwide. Persistent behavioral health issues have a wide range of consequences that affect people personally, culturally, and socially. Major depressive disorder (MDD) is a psychiatric ailment that affects people of all ages worldwide. It has grown into a major global health issue as well as an economic burden. Clinicians are using several medications to limit the growth of this disease at an early stage in young people. The goal of this research is to improve the depression diagnosis by altering Electroencephalogram (EEG) signals and extracting the Differential Entropy (DE) and Power Spectral Density (PSD), using machine learning and deep learning techniques. This study analyzed the EEG signals of 30 healthy people and 34 people with Major Depressive Disorder (MDD). K-nearest neighbors (KNN) had the highest accuracy among machine learning algorithms of 99.7%, while Support vector machine (SVM) had acquired 95.7% accuracy. The developed Deep Learning approach, convolution neural network (CNN), achieved 99.6% accuracy. With these promising results, this study establishes the viability of an Electroencephalogram based diagnosis of MDD.
Keywords: Major Depressive Disorder, electroencephalogram, K-Nearest Neighbors, Support Vector Machine, Convolutional neural Network, Power Spectral Density, Differential Entropy.
INTRODUCTION
Major depressive disorder (MDD), popularly referred to as depression, is one of the commonly spread mental illnesses, with projections that it will be the main benefactor to the Global Burden of Disease (GBD) by 2030 [1]. MDD is a psychiatric disorder that is frequently associated with reduced self-esteem, feelings of guilt, difficulty in concentrating, and in the end, it can eventually lead to suicidal thinking [2]. Depending on the intensity of the symptoms, it is classified as mere, moderate, or intense. Globally, it is estimated that over 300 M (million) people of various groups of ages suffer from depression [3]. Treatment of depression can be done with the help of psychiatric therapy or medication if it is detected properly, still, it remains a consistent health problem at the societal level because it is frequently misdiagnosed [3]. Electroencephalogram (EEG) is a productive and acknowledged diagnostic method to acquire the electrical activity of the human brain. It is being utilized substantially to research and detect multiple encephalopathies in the current years.
Electroencephalogram based classic Machine Learning (ML) techniques have recently gotten a lot of interest because of their capacity to classify the neuroimaging data, which in nature is noninvasive, and develop computer-aided diagnostic (CAD) solutions to help with depression detection [4, 5, 6, 7, 8]. A depression diagnostic index was released which is all about the non-linear feature extraction from EEG data [9]. The use of machine learning techniques has been demonstrated to be beneficial. Even though research findings have been more widely disseminated, the clinical application has been limitedly clear. As a result, more research is required to confirm the findings with emerging methods that can attain great efficiency and be regarded as a viable option for therapeutic use. Since EEG signals are made up of five distinct waves. The actions, feelings, and thoughts of an individual are conveyed among the neurons in the nervous system.
All brainwaves are generated by periodic electrical pulses from many neurons connected to one another. The frequencies of brainwaves differ. The usual names for these Electroencephalogram waves are delta (D), theta (T), alpha (A), beta (B), and gamma (G). Hertz (cycles per second) is the unit of measurement (Hz). Delta (D) brainwaves (1-3 Hz) are slow and have biggest amplitude among all brain waves, found during deep sleep and unconsciousness. In general, dominant brainwave states are associated with different levels of consciousness. Because theta (T) brainwaves (4-7 Hz) reflect a daydream or space- like mental condition, they are linked to mental slowness. At an extremely low extent, the activity of this brain wave is quiet common, and it represents a zone between waking and asleep. Alpha waves are slower and larger than beta waves (8-12 Hz). They're associated with a calm mood and indicate that the brain is going into standby mode, ready to respond if necessary. When eyes are closed, and something pleasant is imagined, the intensity of these brainwaves inflates. Beta (B) brainwaves (13–38 Hz) are minute, fast waves associated with cerebral and intellectual activity, and being extremely attentive. It shows the condition of being alert. Gamma (G) waves (39–42 Hz) are highly sensitive brain waves. Gamma rhythm has an impact on perception and awareness.
The initial research concentration on Electroencephalogram (EEG) controlling mental tasks, which initiated the idea of brain-computer interface (BCI), is on humans being capable enough to handle their nervous system rhythm by doing certain mental activities. Signal acquisition, extraction of important features, classification, and modification to the output device are the four steps of a typical BCI system [10]. Feature extraction is a key part of creating a high-performing BCI. Several studies have demonstrated that employing an efficient feature extraction approach rather than an efficient classifier can increase ultimate performance [11]. Several approaches can be utilized to look into variations in the complexity of the EEG signals that are linked to depression. Researchers have shown the characterization of MDD is by greater EEG complexity in contrast to the normal counterparts.
Signal capture using reduced electrode sensors can minimize the computing complications of ML models and strain out extraneous noises in brain-computer interface (BCI) equipment. Differential entropy (DE) and Power Spectral Density (PSD) are essential components of emotional signals that might indicate changes in regional activity. As a result, a technique of DE and PSD features recognition based on multiple Machine Learning models was proposed in this research to acquire prominent feature signals and increase classification accuracy based on features extracted.
RELATED WORK
Before beginning our research, a list of previous study characteristics was compiled to compare and debate reliable methods and outcomes. In persons with depression, Berman et al. [12] discovered that anxious behaviors could only be diagnosed in the EEG recordings of resting-state and non-tasked signals. The electrodes count and position used to acquire the signals and the standards employed in the investigations were all different. The data preparation methods were then examined, which varied in the studies, either typical sub-bands or broadband signals were employed. The raw signals were analyzed along with some reduction techniques, for instance Fourier perusal, wavelet-based or cosine transmute. Some chose to manually or remove the artifact or to remove the noise (automatically) by certain approaches.
In contrast others rely on the evaluation of the epochs from noiseless areas of obtained signal (potentially creating new sources of artifacts in the process) (no artifact removal). The amount of filtering and preprocessing done, whether researchers concentrated on any particular feature of the spectral makeup of the signal, were other points of discussion. The techniques utilized to extricate or choose the features differed from study to study.
The EEG samples of 30 MDD subjects and 30 MDD free people were collected by Faust et al. [13]. He used wavelet packet decomposition to extricate sub-bands from the raw EEG data. The collected sub-bands were used to determine bispectral entropy (containing maximum sequenced spectra approach from Fourier perusal), Renyi entropy, approximation entropy, and sample entropy. The entropy measures were calculated using the sub-bands that were recovered as input. With 10-fold cross-validation, a mixture model (Gaussian), decision tree model, KNN, PNN, NBC, fuzzy classifier (Sugeno), and SVM were implemented. The accuracy obtained was 99.5 percent, with a sensitivity of 99.2 percent and a specificity of 99.7 percent.
A technique based on EEG signals from the scalp was developed by Liao et al. [14]. It contained robust spectral, spatial feature extrication of EEG signals based on the kernel eigen filter bank common spatial pattern (KEFB-CSP). They then filtered each sub-multichannel band's EEG data (30 electrode traces) from the indigenous electrode space to a new area where the current EEG signals, i.e., CSPs, are most appropriate for discriminating MDD subjects from those with the healthy controls. Lastly, they employed PCA (kernel) to convert CSPs from every frequency sub-bands to the vector feature of KEFB CSP, which is a lower-dimensional feature vector. Using KEFB CSP, the study had achieved an accuracy of 80%.
Mumtaz et al. [15] in 2017 reported just one sample size with the same methodologies proposed three techniques [15] and two investigations in the year 2018 with 33 depressed and 30 healthy people [16, 17]. Mumtaz et al. [15] achieved 91.7 percent LR classification accuracy, 98 percent SVM classification accuracy, and 93.6 percent NB classification accuracy.
In addition to the SASI spectral measure, Bachmann et al. [18] evaluated the HFD, DFA and Lempel-Ziv complexity (LZC) from the EEG signals as features. A total of 26 people were employed in the study, 13 of them had MDD, while 13 healthy people were chosen to gather their EEG signals. He used LOOCV and logistic regression to classify persons based on their traits. Using nonlinear measures to characterize the resting-state EEG resulted in exceptionally effective classification. With HFD and DFA, and HFD and LZC, he reached the greatest accuracy of 85 percent, and high accuracy of 77 percent with only one nonlinear component.
Mohammadi et al. [19] employed a genetic algorithm that (GA) to determine the closely relevant characteristics after mapping the EEG features into the new space of the feature, which is the data evaluation phase. He then used DT to build several other prediction models. The EEG signals were gained from 53 depressed patients and 43 normal volunteers. The model they employed for their investigation had an average accuracy of 80%. In terms of generalizations, the authentication of brilliant accuracies achieved in the study was missing and ambiguous. It questions the reliability of the study along with the validation. The average accuracy of ML models was in between 90.24 percent to 97.56 percent, according to Cukic et al. [20]. The Sample Entropy metric outperformed the other two. This study looked at the brain waves of 26 MDD and 20 normal people. When compared to previous research, including only the resting EEG signals with eyes opened or closed only, it became a possibility to authenticate that the electrodes number is a significant influence, as PCA data illustrated that each electrode has its very own effect on the outcomes [20, 21].
The related work clearly shows that the EEG features depict some great information about various brain pathologies and the evaluation of only resting EEG signals has reached to a bottleneck. So, analysis of EEG features from the non-resting EEG signals was entailed. In this proposed research, a complete feature-based framework is developed to analyze the Differential Entropy and Power Spectral Density of EEG signals. It is then followed by a complete process of feeding the features into several Machine Learning algorithms to classify pathological and non-pathological EEG from resting and non-resting EEGs.
MATERIAL AND METHOD
Participants: This research is based on a dataset provided by Mumtaz [22], which is freely available to the public. The committee approved the procedure of ethics of Hospital University Sains Malaysia. The depressed (MDD) patients qualified the diagnosis criteria for unipolar depression without any psychotic symptoms. Participants were required to abstain from caffeine, nicotine, and alcohol before recording brain signals. To avoid any errors, data collection for each participant was done at the same time of day. The EEG data were captured for a short period of time, 5 minutes, which helped the subjects avoid tiredness and disinterest. EEG signals were obtained from 30 healthy people ranging in age from 22 to 53 (mean = 38.3 +/-15.6) and 34 people with severe depressive disorder ranging in age from 27 to 53 (mean = 40.3 +/-12.9).
EEG data acquisition and preprocessing: The brain waves were recorded utilizing an EEG cap on the scalp and the 10-20 international standard placement of electrode system, as shown in figure 1. EEG signals were recorded for 5 minutes in several states: open eyes (EO), closed eyes (EC), and while executing a cognitive task (P300). Temporal (t3, t4, t5, t6), occipital (O1, O2), frontal (fp1, fp2, f3, f4, f7, f8, fpz), parietal (P3, P4, P7, P8), and central (C3, C4) electrodes are placed on the skull and cover all four lobes. EEG signals were re-referenced to the infinity reference (IR) for further EEG analysis using a reference electrode (LE) attached to the ear [23].
The reference electrode is utilized to influence the amplitude at each EEG channel and at a certain time point by establishing the electrode potential. The reference electrode determines the zero voltage level, and the rest of the channels are stated in respect to the reference electrode. EEG signals are among the most complicated and disordered biological signals. Muscle artifacts or EMG signals, heart signals or ECG, eyeball movements EOG, or interference with another device can all generate disturbance in these signals.
All raw EEG data must first be denoised in order to achieve accurate findings in the feature extraction and classification models.The noise is removed using a series of filters. The sample frequency of the EEG signals was adjusted to 256 Hz in order to exclude these unrequired signals. A Notch filter was later used to denoise the 50 Hz power line. Also, an amplifier was employed to boost all of the weak brain signals simultaneously. To fully process the raw the EEG signals, they were band-pass filtered with cutoff frequencies of 0.1 Hz and 50 Hz for each channel (22 channels) and state (EO, EC, and TASK).
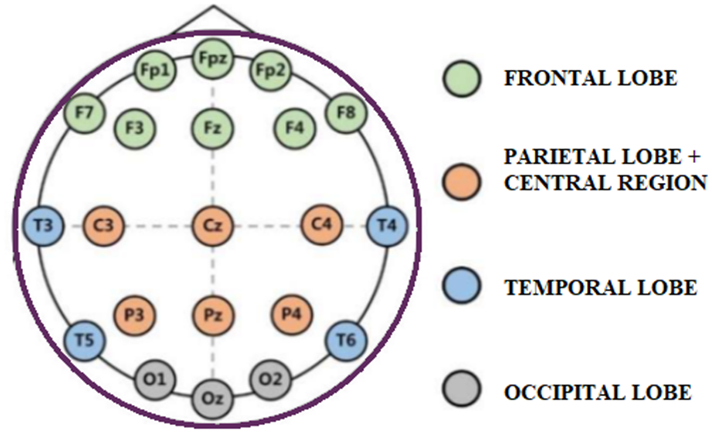
Figure 1. shows the international 10-20 electrode placement system
METHODOLOGY
The EEG signals data is first preprocessed then the extrusion of two EEG features is done. The extracted features are then provided to various classifiers, and then the performance is measured.
Feature extraction: The main principle behind feature extraction is that the highly dimensioned input data is turned into a smaller representative collection of characteristics that still contain important data. The power spectral density (PSD) method is a widely featured extraction technique because it isolates the important properties of signals that allow the observation of mental and moving tasks [24]. Most prior studies [25–29] employed this strategy to investigate epileptics and hypnosis.
PSD techniques have shown to be the most consistent in terms of robustness and efficacy in extruding the different patterns of spectra needed to effectively discriminate among motor imagery EEG signals [30]. A novel extraction of features method based on the Power Spectral Density (PSD) and Differential Entropy (DE) of the signal's frequency distributions is presented. We initially estimated the PSD using the Welch Periodogram method, using a 400-point hamming window with a 50% overlap between subsequent windowed portions. For each participant, we visually examined the entire frequency range. In keeping with prior research [31, 32], we discovered that the PSD had a consistent pattern with varying amplitudes across all subjects and tasks. This physiologic phenomenon enables the classification of various mental functions, including depression.
The baseline signal was separated into three parts for Differential Entropy (DE) using sliding windows of 1, 10, 30, and60 seconds. The original signal length was the 60s; hence 60 seconds was the time- step window. A τ window divided the signal into à=60/τ, à=60/τ portions. The actual data's channel signal was extracted. Each segment's original signal was decomposed into alpha brain wave, beta brain wave, gamma brain wave, theta brain wave, and delta brain wave using Butterworth filters.
The feature extraction is followed by the classifying of EEG signals into MDD and normal subjects. The models used are KNN, SVM, and CNN. In the end, the performance is measured with the help of a confusion matrix. The confusion obtains the classification accuracy of the various models used. The steps taken in the proposed methodology are presented.
Classification
Figure 2 depicts the step by step flow of methods followed in this study, including EEG preprocessing, feature extraction, new feature generation, and classification using several models. K-Nearest Neighbors (KNN), Support Vector Machine (SVM), and Convolutional Neural Network (CNN) were the machine learning classifiers employed in this study. The preprocessing is followed by feature extraction, which extracts PSD and DE, and finally, classifiers are fed with predetermined features to detect depressed and healthy patients. The block diagram of the proposed methodology is presented in figure 2.
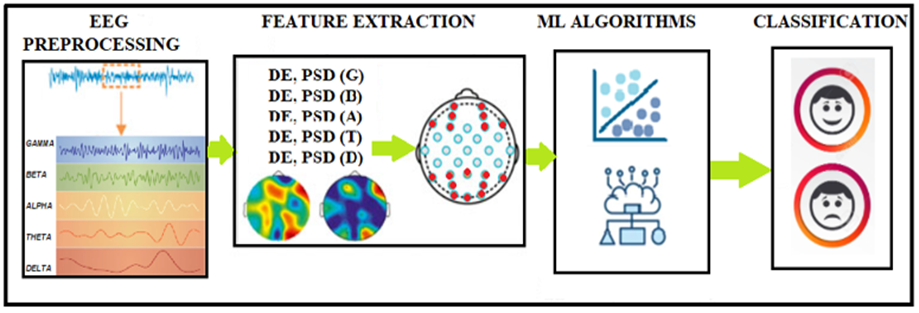
Figure 2. illustrates the block diagram of employed methodology.
K-Nearest Neighbors (KNN): The supervised classifier K-Nearest Neighbors is one of the most basic classification models. For pairs of monitoring, KNN uses an in-space function. The K-Nearest Neighbor algorithm finds the k-nearest training sample for a test sample. After then, the testing sample is assigned to a certain class, which is usually the most common class among all the k-nearest training data. The KNN method requires an integer value for the variable k and a metric to calculate proximity [33].In this suggested study the n-neighbors hyper parameter was set to 5, which is the default value. To avoid a snag in the classification, an odd number is chosen.
Support Vector Machine (SVM): A support vector machine (SVM) divides the space of features into decision borderlines, which must be linear in the modified area, explained by the kernel function, and uniquely provided by a subset of the data [34, 35]. The maximum margin classifier created by Support Vector Machines widens the space between the decision boundary and the support vectors. Coupled with the soft-margin classifier, the permanent regularization value of a constant C = 1 was used in the study. SVMs are supervised by nature, and by design, they increase the classifier margin, lowering the error rate.
Table 1. is describing the parameters used for CNN model
|
Parameter |
Value |
|
Batch size |
32 for input 64 for output |
|
Optimizer |
Rmsprop |
|
Learning rate |
0.1 |
|
Filter size |
32 for input 64 for hidden and 1 for output |
|
Loss function Epochs |
Binary cross entropy 20 |
Convolutional Neural Network (CNN): Two 1D convolutional layers, one flatten layer, and two dense layers make up the suggested model. The hidden layers employ the relu activation function, whereas the output layer uses softmax, with a batch size of 32 for input and 64 for output. The input layer has a filter size of 32, the hidden layer has a filter size of 64, and the output layer has a filter size of 1. Tensorflow was used to create the CNN model. Rmsprop is the optimizer used for the suggested model since it improves accuracy and reduces losses. Because the learning rate is one of the most essential hyperparameters, Keras`s deep learning library was able to obtain the best learning rate. The significant improvement was calculated across 20 training epochs, with the learning rate inflated by a minute factor until it reached 0.1.
These parameters were assessed using k-fold cross- validation on the training set. Various strategies such as batch processing, dropout, cross-validation, and balanced training were used to optimize the model and avoid the phenomena of overfitting. The training and validation of the classifier were set at 80% and 20% of the total data, respectively.
Figure 3 shows the working of the proposed model. Finally, a SoftMax classifier was used at the layer to acquire the DE and PSD feature signal recognition results. Table 1 shows the parameters set for the CNN model which includes the number of epochs, batch size, optimizer utilized, the learning rate set, filter size and the loss function.
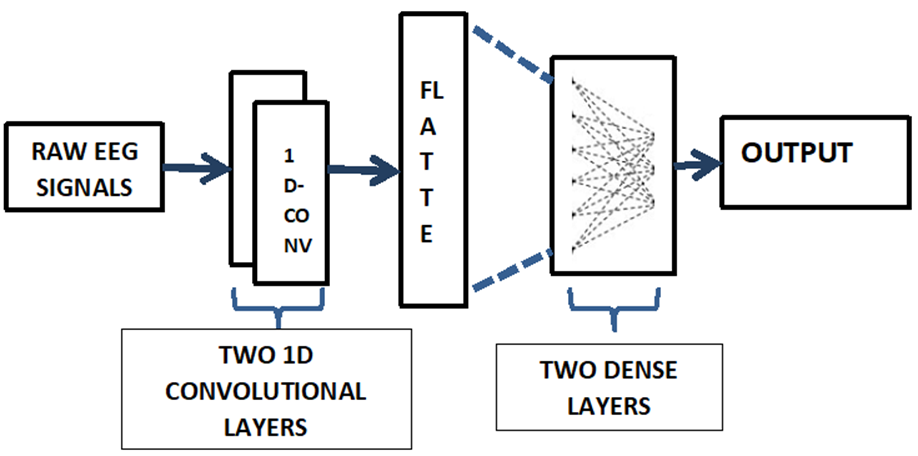
Figure 3. shows the working of proposed CNN model.
RESULTS
The evaluation of performance is an essential component of any research project. In this research, the results were based on classification accuracy and time complexity, which are proved as reliable sources to measure the model’s performance. The classification accuracy is one of the most popular and reliable metric for assessing a model's performance. The confusion matrix was used to determine classification accuracy in the proposed study. Accuracy of the classification is basically a measure that indicates a classification model's performance by dividing the number of correct predictions made by the model with total number of predictions. The higher the classification accuracy the better a model has performed. The classification accuracy of all the models is shown in figure 4.
Whereas, the time complexity of the algorithms deployed measures of how long an algorithm takes to run as a function of the length of the input. This parameter is crucial in determining how well an algorithm works. Deep neural networks need a long time and a lot of space to run. On the other hand, the linear regression models produce results in a shorter amount of time, but their performance is not up to the standard. This demonstrates a tradeoff between resource demand and algorithm efficiency. Reducing the runtime complexity can be achieved by reducing the number of irrelevant characteristics, variables, and data kinds, and data optimization. The training time of all the models is summarized in figure 5.
Table 2. Shows the classification accuracy of the proposed research
|
Model |
Classification Accuracy (%) |
|
KNN |
99.7 |
|
SVM |
95.7 |
|
CNN |
99.6 |
Firstly, the classification algorithms' performance was assessed using the PSD and DE vectors. K -nearest neighbors (KNN), Support Vector Machine (SVM), and Convolutional Neural Network (CNN) was chosen as two standard Machine Learning classifiers and one Deep Learning classifier. In s-klearn, the classifier parameters were set to the default values with only just few exceptions. Cross-validation, the elimination of unneeded features, and the training of a larger fraction of data prevented the phenomenon of over fitting.
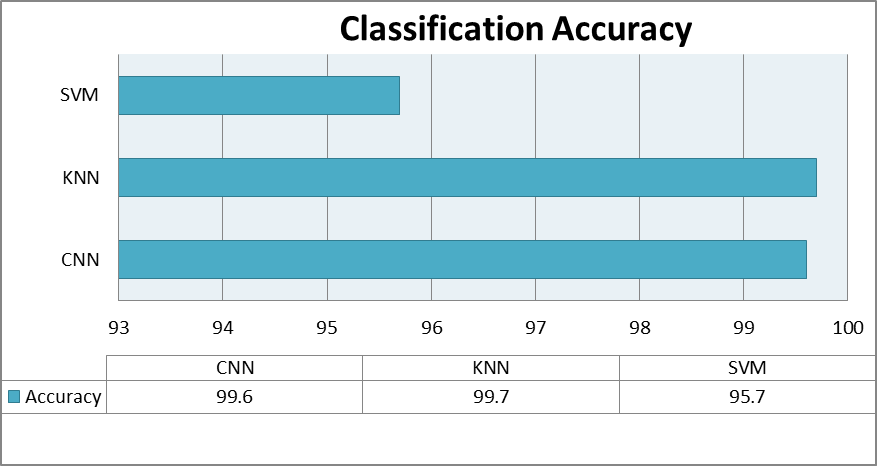
Figure 4. Shows the classification accuracy of all the proposed models.
The best accuracy was 99.7 percent obtained by the K-Nearest Neighbors (KNN) model, and 95.7 percent is achieved by the Support vector machine (SVM); greater than 90% classification performance was obtained for the accuracy for the two classical ML models. The brain signals of normal and MDD participants were then evaluated using a deep learning architecture. The proposed CNN model performed extraordinarily well, with a 99.6% accuracy rate. On the contrary the CNN model took more computational time as compared to KNN and SVM. The SVM model was the fastest to compute among all. On the contrary, the CNN model took longest time to compute. The table 2 shows the classification accuracy of the models used in proposed methodology. The table 3 summarizes the time complexity of the algorithms used in proposed methodology.
Table 3. Depicts the models' training time.
|
Model |
Training time (s) |
|
|
KNN |
165.9 |
|
|
SVM |
125.7 |
|
|
CNN |
596.3 |
|
DISCUSSION
The main objectives of this study were to analyze the non-resting EEG signals with some decision making tasks along with the resting ones. From the studies, it is proved that MDD deteriorates the cognitive abilities, so the analysis of EEG signals with some cognitive information was required for better understanding of this ailment. Along with it the analyses of various features was also needed to understand the nature of EEG signals of depressed and normal subjects. In this study, we analyzed resting and non-resting EEG signals of 34 depressed patients 30 normal subjects from five EEG bands and two different features. The EEG signals were acquired from all five bands (alpha, beta, theta, gamma and delta) from both the hemispheres of brain. The two features were then extracted which were DE and PSD. These extracted features were then fed into the classifiers. Three different classifiers were employed in this research. The KNN classifier outperformed the SVM and CNN classifiers in this categorization.
Furthermore, frequency based, time based and nonlinear aspects of EEG signals should be examined for evaluating EEG of depressed individuals, suggested by this study. In addition, instead of recording and analyzing EEG signals in resting state and decision-making tasks only, EEG in a variety of conditions and activities could be acquired as it can help to evaluate depressed patients and normal individuals. Future research should focus on identifying the brain areas that are implicated in depression.
Lastly, more EEG data would allow researchers to test the accuracy of these features being extracted and the classifiers employed. These phenomenal obtained results in terms of classification accuracy and training time confirmed that PSD and DE features are potentially useful features to evaluate EEG signals. The inflated classification accuracy shows that the non-resting and resting EEG signals of depressed and normal subjects are classified virtuously.
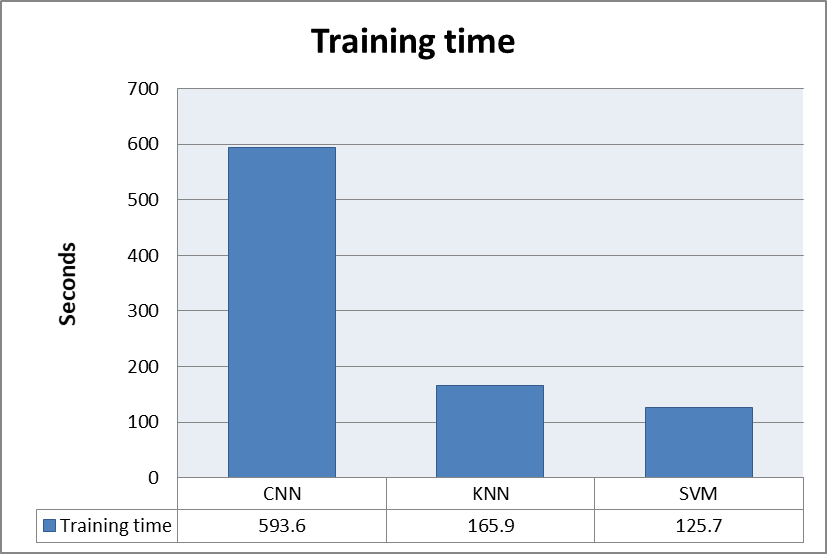
Figure 5. shows the training time of all the proposed models.
CONCLUSION
This paper proposes a Differential Entropy (DE) and Power Spectral Density (PSD) feature signal extraction method based on EEG signals in multiple Machine Learning algorithms. The DE and PSD feature signals were extracted at different time scales to analyze the various properties of EEG signals. The extracted features were respectively fed into SVM, KNN, and 1DCNN models, which achieved recognition accuracy of 99.7% by the K-Nearest Neighbors (KNN) model, 95.7% by the Support vector machine (SVM), and 99.6%, by Convolutional Neural Network (CNN). It was found that DE and PSD feature signals provided great accuracy and less computational time, which was significant in developing a recognition device based on the BCI system. Along with it, the proposed study has successfully classified the non-resting EEGs with cognitive information. So, the objectives of the research were obtained with flying colors.
Acknowledgement. The Authors are thankful to Mehran University of Engineering and Technology for computational resources.
Author’s Contribution. All the authors contributed equally.
Conflict of interest.The authors declare no conflicts of interest regarding the publication of this paper.
Project details.This research was conducted as a master’s thesis; the research investigation was completed in November 2021.
REFERENCES
[1] Mathers, C. D., & Loncar, D. (2006). Projections of global mortality and burden of disease from 2002 to 2030. PLoS medicine, 3(11), e442.
[2] World Federation for Mental Health, Depression: a global crisis, Occoquan, VA, USA, (2012).
[3] World Health Organization, Depression, obtained from http://www.who.int/ mediacentre/factsheets/fs369/en/, 2017.
[4] Alhaj H, Wisniewski G, McAllister-Williams RH (2011) the use of the EEG in measuring therapeutic drug action: focus on depression and antidepressants. J Psychopharmacol 25:1175–1191
[5] Mumtaz W, Malik AS, Yasin MAM, Xia L (2015) Review on EEG and ERP predictive biomarkers for major depressive disorder. Biomed Signal Process Control 22:85–98
[6] Mumtaz W, Xia L, Ali SSA, Yasin MAM, Hussain M, Malik AS (2017) Electroencephalogram (EEG)-based computer-aided techniqueto diagnose major depressive disorder (MDD). Biomed Signal Process Control 31:108–115
[7] Olbrich S, Arns M (2013) EEG biomarkers in major depressive disorder: discriminative power and prediction of treatment response. Int Rev Psychiatry 25:604–618
[8] Narejo S, Pasero E, Kulsoom F. EEG based eye state classification using deep belief network and stacked autoencoder. International Journal of Electrical and Computer Engineering (IJECE). 2016 Dec 1;6(6):3131-41.
[9] Acharya UR, Sudarshan VK, Adeli H, Santhosh J, Koh JE, Puthankatti SD et al (2015) A novel depression diagnosis index using nonlinear features in EEG signals. Eur Neurol 74:79–83
[10] A. Bashashati, M. Fatourechi, R. K. Ward, and G. E. Birch, “A survey of signal processing algorithms in brain-computer interfaces based on electrical brain signals,” Journal of Neural Engineering, vol. 4, no. 2, pp. R32–R57, 2007.
[11] N. Brodu, F. Lotte, and A. Lécuyer, “Exploring two novel features for EEG-based brain-computer interfaces: Multifractal cumulants and predictive complexity,” Neurocomputing, vol. 79, pp. 87–94, 2012.
[12] Berman MG, Peltier S, Nee DE, Kross E, Deldin PJ, Jonides J. Depression, rumination and the default network. Soc Cogn Affect Neurosci 2011 Oct;6(5):548-555
[13] Faust O, Ang PC, Puthankattil SD, Joseph PK. Depression diagnosis support system based on EEG signal entropies. J Mech Med Biol 2014 Mar 13;14(03):1450035.
[14] Liao S, Wu C, Huang H, Cheng W, Liu Y. Major depression detection from EEG signals using kernel eigen-filter-bank common spatial patterns. Sensors (Basel) 2017 Jun 14;17(6):1-18
[15][Mumtaz W, Xia L, Ali SS, Yasin MA, Hussain M, Malik AS. Electroencephalogram (EEG)-based computer-aided technique to diagnose major depressive disorder (MDD). Biomedical Signal Processing and Control 2017 Jan;31:108-115.
[16]Mumtaz W, Xia L, Mohd Yasin MA, Azhar Ali SS, Malik AS. A wavelet-based technique to predict treatment outcome for major depressive disorder. PLoS One 2017;12(2):e0171409
[17]Mumtaz W, Ali SS, Yasin MA, Malik AS. A machine learning framework involving EEG-based functional connectivity to diagnose major depressive disorder (MDD). Med Biol Eng Comput 2018 Feb;56(2):233-246.
[18] Bachmann M, Lass J, Suhhova A, Hinrikus H. Spectral asymmetry and Higuchi's fractal dimension measures of depression electroencephalogram. Comput Math Methods Med 2013;2013:251638
[19] Mohammadi M, Al-Azab F, Raahemi B, Richards G, Jaworska N, Smith D, et al. Data mining EEG signals in depression for their diagnostic value. BMC Med Inform Decis Mak 2015 Dec 23;15:108
[20] Čukić M, Pokrajac D, Stokić M, Simić S, Radivojević V, Ljubisavljević M. EEG machine learning with Higuchi’s fractal dimension and Sample Entropy as features for successful detection of depression. arXiv 2018
[21] Čukić M, Stokić M, Simić S, Pokrajac D. The successful discrimination of depression from EEG could be attributed to proper feature extraction and not to a particular classification method. Cogn Neurodyn 2020 Aug;14(4):443-455.
[22] Mumtaz W, Xia LK, Ali SSA, Yasin MAM, Hussain M, Malik AS Electroencephalogram (EEG)-based computer-aided technique to diagnose major depressive disorder (MDD) (2017).
[23] Qin Y, Xu P, Yao D ,A comparative study of different references for EEG default mode network: the use of the infinity reference. Clin Neurophysiol 121:1981–1991 (2010).
[24] N. Brodu, F. Lotte, and A. Lécuyer, “Exploring two novel features for EEG-based brain-computer interfaces: Multifractal cumulants and predictive complexity,” Neurocomputing, vol. 79, pp. 87–94, 2012.
[25] C. Mosquera, A. M. Trigueros, J. I. Franco, and Á. Navia-Vázquez, “New feature extraction approach for epileptic EEG signal detection using time-frequency distributions,” Medical & Biological Engineering & Computing, vol. 48, no. 4, pp. 321–330, 2010.
[26] L. Fraiwan, K. Lweesy, N. Khasawneh, H. Wenz, and H. Dickhaus, “Automated sleep stage identification system based on time-frequency analysis of a single EEG channel and random forest classifier,” Computer Methods & Programs in Biomedicine, vol. 108, no. 1, pp. 10–19, 2012.
[27] S. Deivanayagi, M. Manivannan, and P. Fernandez, “Spectral analysis of EEG signals during hypnosis,” International Journal of Systemics, Cybernetics and Informatics, pp. 75–80, 2007.
[28] A. Subasi, E. Erçelebi, A. Alkan, and E. Koklukaya, “Comparison of subspace-based methods with AR parametric methods in epileptic seizure detection,” Computers in Biology and Medicine, vol. 36, no. 2, pp. 195–208, 2006.
[29] M. Naji, M. Firoozabadi, and P. Azadfallah, “Classification of Music-Induced Emotions Based on Information Fusion of Forehead Biosignals and Electrocardiogram,” Cognitive Computation, vol. 6, no. 2, pp. 241–252, 2014.
[30]L. Duan, H. Zhong, J. Miao, Z. Yang, W. Ma, and X. Zhang, “A Voting Optimized Strategy Based on ELM for Improving Classification of Motor Imagery BCI Data,” Cognitive Computation, vol. 6, no. 3, pp. 477–483, 2014.
[31]K. Kirschfeld, “The physical basis of alpha waves in the electroencephalogram and the origin of the "berger effect",” Biological Cybernetics, vol. 92, no. 3, pp. 177–185, 2005
[32]R. Grave De Peralta Menendez, Q. Noirhomme, F. Cincotti, D. Mattia, F. Aloise, and S. González Andino, “Modern electrophysiological methods for brain-computer interfaces,” Computational Intelligence and Neuroscience, vol. 2007, Article ID 56986, 8 pages, 2007.
[33]A. Webb, Statistical Pattern Recognition, Oxford University Press Inc, New York, 1999
[34]Jolliffe JL (2002) Principal component analysis, 2nd edn. Springer, New York, pp 10–150
[35]Furqan, M., Rajput, H., Narejo, S., Ashraf, A. and Awan, K., Heart Disease Prediction using Machine Learning Algorithms. Second International Conference on Computational Science And Technology (INCCST) 2020
 |
Copyright © by authors and 50Sea. This work is licensed under Creative Commons Attribution 4.0 International License. |


