
Novel Technique to Investigate Glacio-fluvial Hypsometry in Hunza Using Local Indicator of Spatial Autocorrelation (LISA)
Syed Amer Mahmood1, Sarah Hassan2, Hania Arif3, Saira Batool4, Areeba Amer5, Muhammad Shahazad6 Rana Muhammad Sohail Aslam7, Bushra Talib8
2Center For Integrated Mountain Research (CIMR), University of the Punjab, Lahore.
3,4College of Earth and Environmental Sciences (CEES), University of the Punjab, Lahore
5Wuhan University China.
1,7 Department of Space Science, University of the Punjab, Lahore
8Department of Technology & engineering, University of the Lahore.
6 Department of Computer Science (PUCIT), University of Punjab
* Correspondence: Syed Amer Mahmood (amerpakistan@gmail.com)
Citation | Mahmood. A, Hassan. S, Batool. Arif. H, “Novel Technique to Investigate Glacio-fluvial Hypsometry in Hunza Using Local Indicator of Spatial Autocorrelation (LISA)”. International Journal of Innovations in Science & Technology, Vol 03 Issue 02: pp 73-85, 2021.
Received |May 11, 2021; Revised | May 28, 2021; Accepted | June 04, 2021; Published | June 09, 2021.
________________________________________________________________________
Abstract
Hypsometric Integral (HI) displays the effect of active tectonics and sensitivity on geomorphic structures. In this study we calculated HI values for Hunza valley to investigate neotectonics, development of topographic structures and process of erosion using SRTM DEM 90m. ArcGIS and MATLAB is used to generate HI and hypsometric curve (HC). We generated HI and HC values by using D8 algorithm in MATLAB to extract drainage basins for 5 and 6 Strahler orders. HI and HC values show the stages of erosion for instance high values of HI and convex HC displays young and tectonically active stage. We used different grid sizes in ArcGIS to calculate maximum, mean and minimum elevation utilizing different statistical techniques. We used Local Indicator of Spatial Autocorrelation (LISA) instead of Global Moran Index to determine the extent of distribution of clustered, dispersed and randomized HI values. This technique indicates high positive z score for auto correlated data. Regions with high HI value indicate relative uplift, undissected and young structures while low HI values indicate sediment accumulation and shallow earthquakes.
Keywords: SRTM DEM 90m, Global Moran Index, Hypsometry, Spatial auto-correlation.
Introduction
Hunza valley is a mountainous region situated in the northern zone of Gilgit Baltistan. The Precambrian aged rock of Hunza comprises of metamorphic and igneous rocks. The rocks in Hunza are identified on the basis of age. Hunza also comprises of the corundum [1]. Hunza comprises of two major tectonic features including Main Karakoram Thrust and Main Mantle Thrust.
Nearly 36000 km2 region of MKT and MMT covers almost plutonic, subordinate sedimentary, volcanic, metamorphosed and deformed rocks. Both tectonic regions display an arc of intra oceanic island developed from the subduction of northward oceanic lithosphere [2]. The study of active tectonics is considered the most advanced tool used for the analysis of hazards and populated areas.
The geography of earth comprises of active tectonics, geographic structures and climate [3]. The geomorphology has emerged along multiple disciplines including geomorphology, geodesy, stratigraphy, geochronology, and seismology. The remote sensing techniques are used in these geomorphologic studies [4].
Hypsometric Integral (HI) displays the effect of active tectonics and sensitivity on geomorphic structures [5]. In this study we computed HI values for Hunza valley to investigate neotectonics, development of topographic structures and process of erosion using SRTM DEM 90m. ArcGIS and MATLAB is used to generate HI and Hypsometric Curve (HC) [6].
The ratio between cross section area and elevation is given by Hypsometry [7]. The area under hypsometric curve provides the value of hypsometric curve. Hypsometrically obtained data determines steps and processes of reshaping of different structures with respect to time within the defined area or natural drainage basins [8,9].
The hypsometric analysis is vital indicator of condition of watershed. It has two components including “Hypsometric Curve” and “Hypsometric Index”.HI has strong association with basin geometry, drainage area and elevation of the basin [10]. HI is independent of drainage area while it is associated with relative rate of uplift. It is scale dependant tool which may be affected by climate, lithology and tectonics [11].
Variations in glaciated terrain depend upon hypsometry, the equilibrium line altitude (ELA) moves due to changing climate [12]. According to the geometry of glacier the accumulation area and ablation of glacier change due to changing elevation. Contrariwise only a small area at the ELA being large in its height may have little variation [13].
Moreover, glaciers having similar ELA exhibit quite different behavior. One glacier with broad accumulation area and a narrow snout while other glacier with narrow upper basin and a wide tongue [15]. The percentage of area of ablation and accumulation zone of glacier can be computed by plotting ELA on HC. It also calculates the variations with respect to time [16].
SRTM DEM 90m was used to compute hypsometric integral (HI). The LISA technique is also used to calculate low and high values of HI clusters [17]. The process of erosion, climatic variations, active tectonics and lithological features of basin are determined by the shape of curve in HC.
Study Area
Hunza is a mountainous region located in the northern zone of Gilgit Baltistan. The Hunza basin is situated in the central region of Karakoram. The basin lies within the 35º 54' to 37º 05' latitude and 74º 02' to 73º 03 longitude respectively. The basin comprises of Gilgit River in the western side, China and Afghanistan in the northern zone, and Indus River and Shigar River in the southern zone. Naltar, Nagar, Shimshal and Chapursan are the major valley of the basin (Figure 1). The basin covers 16,389.4 km2 out of which Hunza River comprises of 87.5% flow [18].
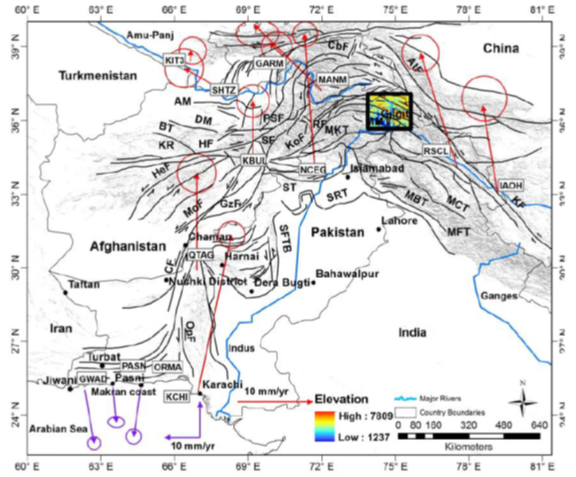
Figure 1. Diagram showing regional tectonics in the context of Indo-Pak-Eurasian collision.
Materials And Methods
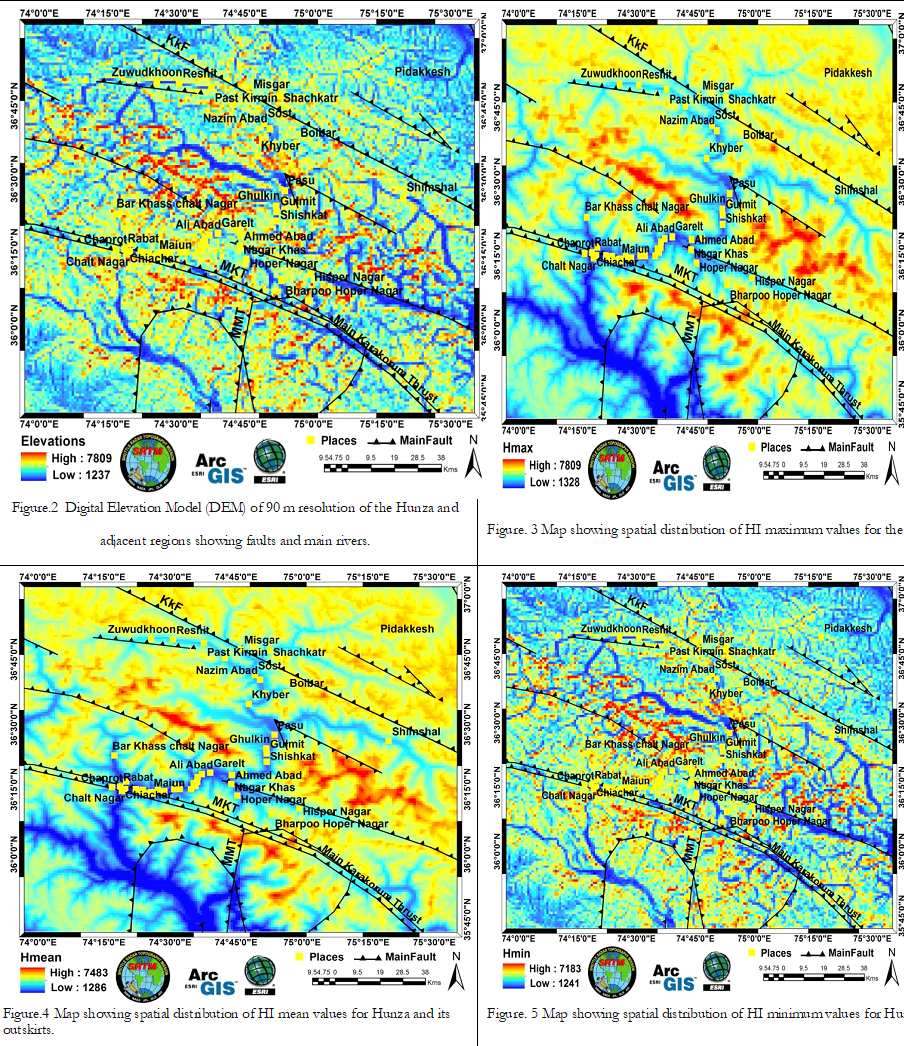
Different grid sizes are required in SRTM DEM 90m to determine HI. SRTM DEM 90m is obtained from http://srtm.csi.cgiar.org/SELECTION/inputCoord.asp.The DEM is precise technique which covers almost all regions of the world. Nearly 16m vertical error occurs in DEM. ArcGIS fills the DEM sinks. Zonal statistics calculates the values of HI for different square grids [19]. It also computes minimum, maximum and mean value of elevations in DEM (Figure 2, 3). The obtained values of HI indicate variations of grid squares with respect to glacial, tectonic and lithological boundaries (Figure 4,5). Due to complexity of landscape both low and high values of HI can appear on the basis of grid squares [20].
Moran Index
In order to obtain the spatial distribution of HI we apply spatial autocorrelation. The spatial autocorrelation and its association are determined in geologically referenced datasets using spatial statistical analysis [21]. Figure 9. Shows the schematic illustration of cells with different HI values due to change in altitude variations depending only on the location of the cells.
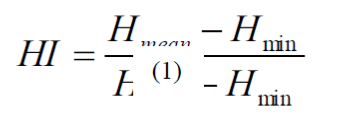
Moran Ӏ index is an accurate tool which computes the spatial autocorrelation precisely. This tool determines the dispersed, random and clustered cell values. This method correlates the observations using following formula.

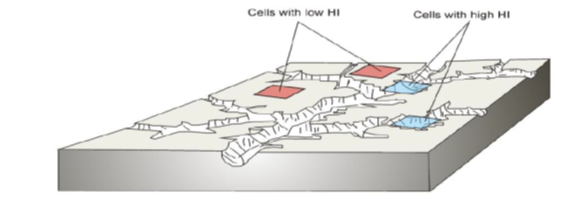
Figure 9. Schematic illustration showing cells with different HI values due to change in altitude variations depending only on the location of the cells.
Where, N represents the number of observations, i,j shows the rows and column of the matrix, wij shows the spatial weighted matrix (SWM) for each observation cells (i,j), and xi and xj are the observations for the i and j location (with mean).
LISA application
GMI method provides average variation and limited association of spatial autocorrelation. LISA technique overcomes this limitation. This technique displays the spatial independence data [22]. This tool is useful for the observation of spatial clustering of global cold and hot spots at different locations. The Moran index is standard tool to determine autocorrelation while LISA explores the association among observations [23]. Specific spatial autocorrelation can be measured using the following equation.
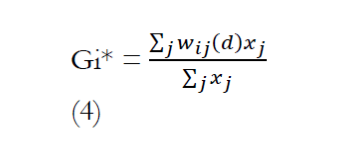
Where, Wij (d) is a weight index of i location with respect to j.
Results and Discussion
Hypsometric Analysis Basin wise
Hypsometric curve and hypsometric integral are computed for Strahler order 5 and 6 in MATLAB for Hunza sub-basins. The obtained values of HC are s shaped, concave in downward direction and convex in upward direction. The Hypsometric curve indicates different stages of erosion, active tectonics and relative rate of uplift. The high HI values are characterized by convex up of HC. It also characterizes the less corrosive regions and high topography which is under development.
Low HI values are indicated by downward concave HC (Figure 11). It also portrays erosion, old stages and even dissection of drainage sub basins. The HI values are normally distributed up to an average mean of 0.25. Distribution of HI does not display clear spatial pattern because of variations in local topography (Figure 10).
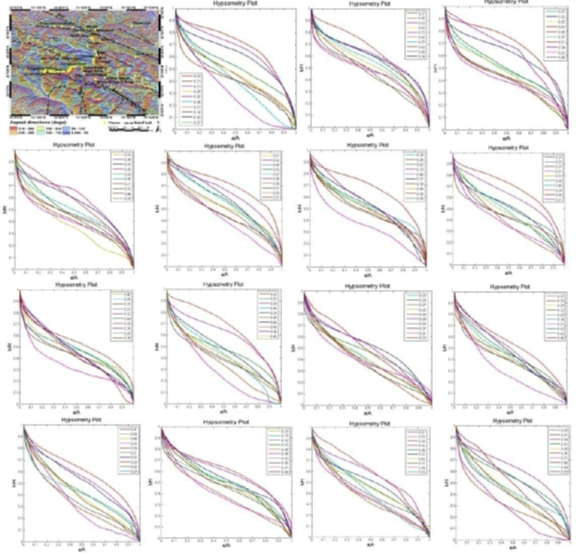
Figure 10. Illustration showing aspect map and hypsometric curves for the subbasin of order 4.
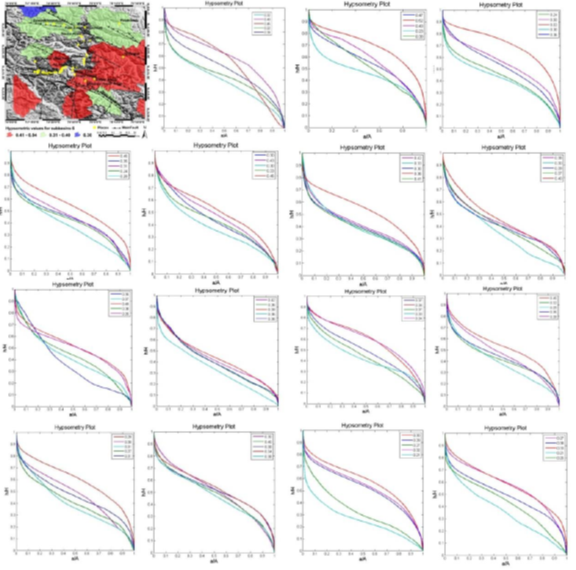
Figure 11. Illustration showing map and hypsometric curves for the subbasin of order 5.
Hypsometric Analysis grid wise
The Moran Index statistics detects the distribution of HI spatial pattern of autocorrelation Table 1 represents Moran Index, Expected Moran Index and z score for each dataset. Figure 12. shows Getis ord G* statistics for various analysis grid sizes (1Km, 2Km and 3 Km) for a fix band distance (FBD) of 3Km.
Table 2 Results of Moran Index for 90m DEM with different analysis square grid
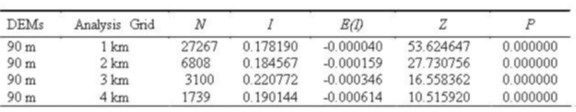
High value of z-score shows the clustering of the data.
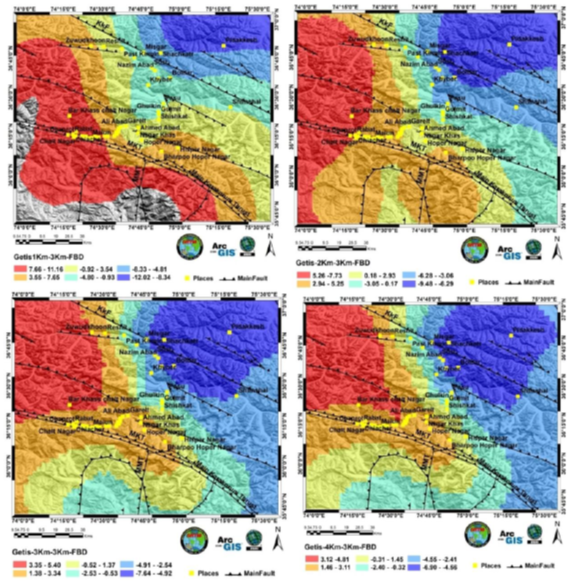
Figure 12. Map showing Getis ord G* statistics for various analysis grid sizes (1Km, 2Km and 3 Km) for a fix band distance (FBD) of 3Km
Discussion
Spatial Dependency of scale
The global Moran I statistics display autocorrelation of HI observations.. HI datasets comprises of high positive values of z scores. The resolution of DEM decreases at different spots by increasing the grid size. The LISA technique is applied using different grid sizes; grids covered different areas although the display remained the same. The value of Z score is inversely proportional to the grid size i.e, it decreases by increasing the size of grid. The Z score exhibits scale dependency of spatial patterns of auto correlation.
Neotectonics and correlation to HI values
The result shows that the red zones and the high values of HI are distributed spatially towards northern east and southern west region of Hunza. They are most significantly distributed along northern east along MKT and MMT faults where relative rate of uplift is high. These faults are has hosted a number of intermediate, shallow and deep earthquakes. The regions with low values of HI are spatially distributed around Gulkin, Passu, Nazim Abad, Bolbar, Sost, Khyber, Shiskat, Misgar, Gulmit, Pidakkesh and Shachkatr which have sediment deposits, shallow earthquakes, fault traces and tectonically active areas.
Conclusions
Hunza valley is a mountainous region situated in the northern zone of Gilgit Baltistan. Analysis and techniques were applied over Hunza valley to illustrate that Global Moran Index (GMI) is a precise tool to compute and locate the spatial patterns in SRTM DEM 90m based datasets. It is observed from the results of GMI that HI values are distributed spatially in the form of low and high values. GMI method provides average variation and limited association of spatial autocorrelation. LISA technique overcomes this limitation. This technique displays the spatial independence data. Both these techniques illustrate that values of HI depend upon the scale. The high HI value indicates active faults and active tectonics while low value of HI indicates shallow earthquakes and sediment deposition.
Acknowledgment
The authors are thankful to the of department of Space Science, University of the Punjab, Lahore Pakistan, for providing necessary provisions regarding GIS and RS related issues and Lab. support.
Refrences
- Eyles, N. and Scheidegger, A. E. ‘Environmental significance of bedrock jointing in Southern Ontario, Canada’. Environmental Geology, vol. 26, pp: 269–77, 1995.
- Eyles, N., Arnaud, E., Scheidegger, A. E., and Eyles, C. H. ‘Bedrock jointing and geomorphology in southwestern Ontario, Canada: an example of tectonic predesign’. Geomorphology, vol.19, pp: 17–34, 1997.
- Anselin, L. ‘Local indicators of spatial association—LISA’. Geographical Analysis, vol. 27, issue no. 2. Pp: 93-115, 1995.
- Chen, Y. C., Sung, Q., and Cheng, K. Y. ( 2003) ‘Along-Strike Variations of Morphotectonics Features in the Western Foothills of Taiwan: Tectonic Implications Based on Stream-Gradient and Hypsometric Analysis’ Geomorphology, vol. 56, issue no. 1-2, pp: 109-137, 2003.
- Twidale, C. R. & Campbell, E. M. Australian Landforms: Understanding a Low, Flat, Arid and Old Landscape. Kenthurst, New South Wales: Rosenberg Publishing, 2005.
- Diniz-Filho, J. A. F., Bini, L. M., and Hawkins, B. A. ‘Spatial Autocorrelationand Red Herrings in Geographical Ecology’. Global Ecology and Biogeography,vol. 12, issue no. 1, pp: 53–64, 2003.
- Gaetani, M., Angiolini, L., Garzanti, E., Jadoul, F., Leven E. Y., Nicora A. & Sciunnach, D. ‘Permain stratigraphy in the Northern Karakorum, Pakistan. ‘Riv. Ital. Pal. Strat., vol. 101, issue no. 2, pp: 107-152, 1995.
- Furbish, D.J., & Andrew, J.T. ‘The use of hypsometry to indicate long-term stability and response of valley glaciers to changes in mass transfer’. Journal of Glaciology, vol. 30, issue no. 105, 1984.
- Hurtrez, J. & Lucazeau, F. ‘Lithological Control on Relief and Hypsometryin the Herault Drainage Basin (France)’. Comptes Rendus de l’Académie des Sciences—Series IIA—Earth and Planetary Science, vol. 328, issue no. 10, pp: 687–694, 1999.
- Hurtrez, J. E., Sol, C., & Lucazeau, F. ‘Effect of Drainage Area on Hypsometry from an Analysis of Small-Scale Drainage Basins in the Siwalik Hills, Central Nepal’. Earth Surface Processes and Landforms, vol. 24, issue no. 9, pp: 799–808, 1999.
- Hussain, S.H., & Awan, A.A. ‘Causative Mechanisms of Terrain Movement in Hunza Valley’, report power point slides, viewed 30 August 2014, 2009.
- Jan, M.Q., & Kazmi, A.H. ‘Plate tectonics configuration of Gemstones of Pakistan’. Islamabad: Quaid-i-Azam University, 2005.
- Keller, E. A., & Pinter, N. Active Tectonics: Earthquakes, Uplift, and Landscape. New Jersey, Prentice Hall, 2002.
- Kent, R. (1991) ‘Lithospheric uplift in easternGondwana: evidence for a long-lived mantle plume sys-tem?’. Geology, vol.19, pp:19–23, 1991.
- Lifton, N.A. & Chase, C.G. ‘Tectonic, climatic and lithological influences on landscape fractal dimension and hypsometry: implications for landscape evolution in the San Gabriel Mountains, California’. Geomorphology, vol. 5, no. 1–2, pp: 77–114, 1992.
- Mahmood, S.A., & Gloaguen, R. ‘Analyzing Spatial Autocorrelation for Hypsometric Integral to Discriminate Neotectonics and Lithologies Using DEMs and GIS’. GIScience and Remote Sensing: John R. Jensen, vol. 48, issue no. 4, 2011.
- Mayer, L., Introduction to Quantitative Geomorphology: An Exercise Manual.Englewood Cliffs, NJ, Prentice Hall, 1990.
- Moran, P. A. P. ‘Notes on Continuous Stochastic Phenomena’. Biometrika, vol. 37. no. 1–2, pp. 173, 1950
- Pike, R. J., & Wilson, S. E. ‘Elevation-Relief Ratio, Hypsometric Integral,and Geomorphic Area-Altitude Analysis’. Geological Society of America Bulletin,vol. 82, no. 4, pp: 1079–1084, 1971.
- Pudset, C.J., Schroider, R., Skelton, P.W., & Gupta,V.J., Cretaceous (Aptian/Albian) age for island arc volcanics. Kohistan, N. Pakistan (Contribution to the Himalayan Geology). India, Hindustan Publishing Corporation, 1985.
- Ratcliffe, J. H., & McCullagh, M. J. ‘Identifying Repeat Victimization withGIS’. British Journal of Criminology, vol. 38, issue no. 4, pp: 651–662, 1998.
- Roohi, R., Dr., Ashraf,A.,Dr., Mustafa, N.,& Mustafa, T. Community Based Survey for Assessment of Glacial Lake Outburst Flood Hazards (GLOFs) in Hunza River Basin. Water Resources Research Institute, National Agricultural Research Centre: Islamabad, 2008.
- Scheidegger, A. E. ‘Morphotectonics of eastern Nepal’. Indian Journal of Landscape Systems andEcological Studies, vol. 22, pp: 1–9, 1999.


