
Power Spectrum of Brain for Complex Task using Electroencephalogram
Raheel Zafar1, 3, Muhammad Javvad ur Rehman2, 3, Hammad Dilpazir2
1Department of Software Engineering (National University of Modern Languages, Islamabad, Pakistan).
2Department Electrical Engineering (National University of Modern Languages, Islamabad, Pakistan).
3Centre for Intelligent Signal and Imaging Research (CISIR) (University Technology PETRONAS, Bandar Seri Iskandar, Perak, Malaysia).
* Correspondence: Raheel Zafar and Email: raheel.zafar@numl.edu.pk
Citation | Zafar.R, Rehman.M.J, Dilpazir.H. “Power Spectrum of Brain for Complex Task using Electroencephalogram”. International Journal of Innovations in Science and Technology. Vol 4, Issue 2, 2022, pp: 383-391
Received | March 26, 2022; Revised | April 19, 2022; Accepted | April 23, 2022; Published | April 25, 2022.
________________________________________________________________________
Cognitive processes are constantly under critical relevance in the field of neuroscience. In the examination of Electroencephalogram (EEG) data, frequency bands are always significant because they determine how the brain responds to various activities and circumstances in different situations. However, it is usually accepted that each brain region is associated with a certain activity, such as auditory, visual, or cognitive tasks. Moreover, to retrieve additional information from the brain, it is often required to establish new neural connections. In this study, the researchers established a functional relationship between different EEG frequencies and the cognitive task under investigation. The frequencies of alpha, beta, and theta waves are often discussed in connection to cognitive tasks, but the frequency of the delta wave is seldom referenced throughout the cognitive process. We then focused on the frequency of delta waves in different parts of the brain, such as the occipitalandfrontalregions.
Keywords: Neuroscience; EEG; cognitive task; Wavelet Coefficients and Power Spectr
Introduction
EEG is a popular and widely used technique for the collection of brain data due to its higher temporal resolution. Since the brain is a complex part of the body, having billions of neurons, it is difficult to measure every brain activity. EEG equipment is available with a higher number of electrodes like 256 or 512, so it can collect enough data to differentiate the task from the baseline or different tasks.
EEG data is often described in terms of frequency bands, which correspond to distinct frequency ranges. Alpha, beta, gamma, theta, and delta are the most frequently encountered frequencies. The frequency range of alpha (α) is between 8 and 15, beta (β) between 16 and 31, gamma (ϒ) between 32 and 50, delta (δ) between 0 and 4, and theta (θ) between 4 and 7 [1]. The θ and δ are located in the slow-wave band, while α and β are located in the rapid wave band. A fast band is characterized by rapid oscillations of neural synchronization, while a slow band is characterized by slow oscillations of neural synchronization. All of the various frequency bands act in a completely autonomous manner under distinct physiological conditions [2]. These different states are due to various brain states which are rapidly changing due to the task or surroundings. These different states are due to various brain states that are rapidly changing due to the task or surroundings. These different tasks changed the neuronal activity in different brain regions. Often, due to the neuronal activity, more than one brain region is activated, and those various brain regions are interconnected for that specific task. A simple example is a visual task, which activates not only the occipital lobe but also the primary visual cortex and the lateral geniculate nucleus. The primary visual cortex is the primary source of a visual task, which is more activated during visual tasks than other brain regions activated for different other tasks [3].
Different EEG frequencies are discussed in existing studies for cognitive tasks [4], [5] as the researchers want to find the brain condition in different tasks. Few studies have discussed the delta band for cognition as various frequencies are involved in cognitive tasks [6], [7]. Moreover, their main focus was only on the frontal region, but in this study, we focused on both the frontal and occipital regions and mainly targeted the fast-wave activity [8].
Power rises or drops in distinct frequency regions of the brain throughout the task, whether it be cognitive or otherwise, in comparison to the baseline power during the task (in this case, eyes open). These frequency bands are either directly or indirectly connected to one another. For example, a rise in alpha power will result in a decrease in theta power [9], [10].
In a study by Wolfgang, the role of alpha frequency is explained in the cognition task [11]. They also mentioned that alpha frequency is dominant during such tasks. The relation between alpha frequency and conscious visual perception is also discussed by Babiloni and his colleagues [12]. Knyazev et al. [13] also discussed the role of beta and delta frequency in their study and mentioned that delta-beta coupling can be seen during anxiogenic situations. The relationship between delta and alpha power during the cognitive task is discussed and proved by Harmony [14]. In the study, it is mentioned that when delta power is increased, the alpha power decreases. In a short-term memory experiment, Ole Jensen [15] mentioned that in the alpha band the oscillations increase with the load on memory. The role of delta frequency during the motivational process is also mentioned in a few studies, such as those discussed by Knyazev [16], [17], and Prada [18] discussed in their studies. Prada explained the role of delta frequency in the human brain for P300 event-related potential.
Other than delta frequency, theta frequency is also discussed and explained in various studies. Like alpha frequency, theta also has a role in the working of the human brain. Raghavachari [19] discussed in the study that theta frequency has a significant role in human memory and sensory processing. The combined role of alpha and theta frequencies is explained by Moran et al. [20], in which it is mentioned that both frequencies correlate with peak frequency. In this study, a working memory task was designed. Moreover, alpha and theta frequencies are also discussed by Lagopoulos et al. [21]. All the above-discussed studies explain the role of delta and theta bands during different cognitive tasks. In this study, theta and delta frequencies are discussed in detail along with the combined role of the occipital region, including the primary visual cortex, during the cognitive task. This brain region is mostly ignored during cognitive tasks for delta and theta frequencies since the existing studies mostly discussed alpha, beta, and gamma frequencies during the cognitive tasks [22].
In the current study, various frequency bands are observed during different tasks, i.e., cognitive tasks and baseline, which is eyes open. Although the frequencies are observed in various brain regions, the primary focus was on the occipital region and primary visual cortex. We have found power for various frequency bands during the two tasks as discussed above. The data was taken from all four lobes of the human brain and focused on slow oscillations.
In this study, the behavior of the human brain is found using EEG. This study is one of the novels as the experiment was designed especially with this study in e-prime. The data was pre-processed and finally, analysis was done in MATLAB. Various techniques and methods were applied to find the significant results from a novel experimental design. The statistical results show that this study is a vital addition to this field and explains the behavior of the brain in a better way.
Materials and Methods
- Participants
In the current study, the data was collected from eight subjects. However, data from seven subjects were used for further analysis. Data from one subject was excluded due to the occurrence of artifacts, and that data did not give significant results. All of them were volunteers, and their ages ranged between 17 and 31 years. All of the subjects were fit and healthy and had normal vision.
- Tasks
The trial comprises two physiological environments: one in which the eyes are open and another in which a cognitive activity is performed. During the eyes open, data was recorded for baseline, and during the cognitive task, data was used as IQ for the subjects. The participants were presented with a questionnaire as part of the assignment. There were a total of 40 questions offered, consisting of both metaphorical and quantitative questions. The question appeared on the screen, and the participant had to choose the right choice. The maximum time of 60 seconds was described for each question. The subject must choose just one option within the allotted one-minute time frame. The difficulty level of questions grew as the number of questions increased. Following an answer to a question, the next question appears on the screen very shortly afterward.
- EEG Recording Procedure
The EEG data for this investigation were collected using a 128-channel Electrical Geodesics Incorporated (EGI) system, which is a US-based company, and was employed for the first time in this study. A sampling frequency of 250 Hz was used in this study. A recording of the EEG was made at the Center for Intelligent Signal and Imaging Research at the University Technology PETRONAS (UTP). The experiment was approved by the local ethics commission. The specifics of the work have previously been described above, along with a description of baseline measurements (eyes open). The proper instruction was provided to the subjects that they should focus on the questions and read them carefully before answering them.
- EEG Data Pre-processing
In this study, the data was preprocessed using paid software from Brain Source Analysis (BESA), a German-based company. During preprocessing, a bandpass filter was used to remove the unnecessary frequencies. After the filtering process, only 0.3 to 40 Hz frequencies were used. Moreover, eye blink artifacts (EOG) and muscular artifacts were also removed using BESA, and data correction was also done with the same tool. The whole data set was visualized manually, and all the unwanted signals were either corrected or removed from the data before further analysis. By using the default block epoch, any unwanted pattern can be removed in BESA. After removing and correcting the artifacts, the data was exported to MATLAB for further processing. All the analysis, after preprocessing, was done in MATLAB.
- Results
The EEG data were collected from 8 subjects with two conditions only, one is the cognitive task and the other is the baseline (eyes open). The data was taken from 128 channels, but the occipital region was finally selected for further analysis. The data was taken from four channels of the occipital region: 70, 75, 82, and 83.
The data of one subject was excluded due to artifacts during EEG recording. The average of seven subjects was taken for further analysis. The results were recorded using two different methods. Firstly, the analysis was done using time-frequency analysis, and secondly, the mean and standard deviation were taken for the 7 subjects at different frequencies, i.e., starting from 1 till 20 for both conditions. The graphs were plotted for both conditions, i.e., baseline and cognitive task. The graphs were shown in 3-D time-frequency representation, which gave a comprehensive analysis of both conditions. Moreover, power for different frequency bands was measured for both conditions. These frequency bands are alpha, beta, theta, delta, and gamma. The graphs were plotted separately for both conditions but only for the occipital region and selected channels, i.e., 70, 75, 82, and 83.
Although power, mean, and standard deviation were found for all four channels, only two of them are mentioned in the results as all four have the same type of behavior during both conditions. Figures 1 and 2 show the power of wavelet coefficients during baseline and cognitive tasks simultaneously for channel 83. It can be observed in Figure 1 that during EO (baseline), the power is low compared to IQ (Figure 2) for delta and theta frequency bands, but it is reversed for alpha and beta, which means the power is high in the case of baseline (EO). The same pattern is observed for the other three frequencies.
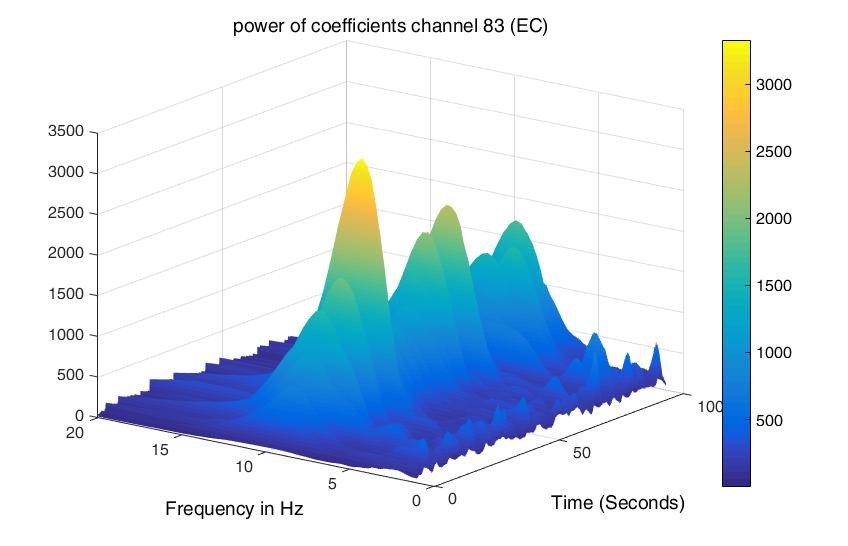
Figure 1: Power found using Wavelet Coefficients for channel 83 during Baseline.
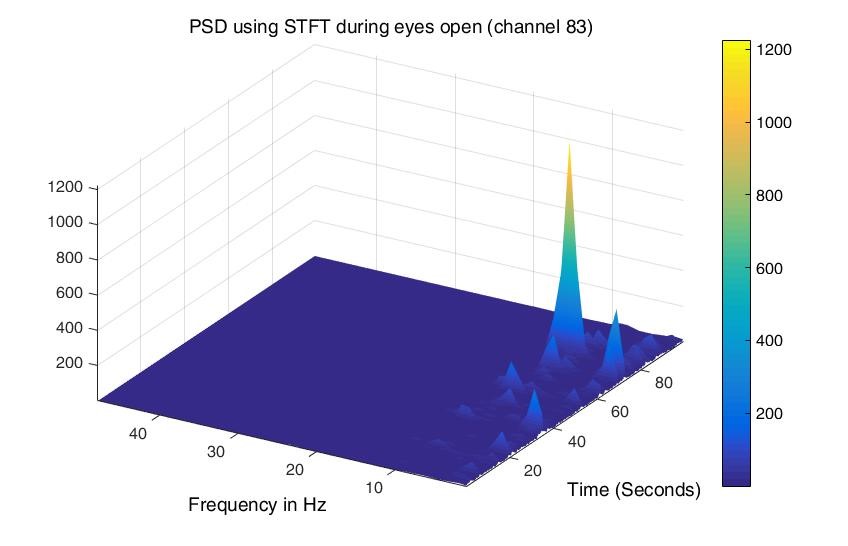
Figure 2. Power was found using Wavelet Coefficients for channel 83 during the Cognitive task.
For statistical analysis, the mean and standard deviation of all the four channels were found, i.e., 70, 75, 82, and 83. In this scenario, there are two different conditions: EO used as a baseline and IQ used as a task. It is hypothesized that significant results can be found between EO and IQ for all the mentioned channels. To verify the hypothesis, a t-test is applied to all given channels against the mean and standard deviation for both conditions, i.e., EO and IQ. The t-test results against mean and standard deviation show significance for EO and IQ, while t-test results between the channels of the same conditions, i.e., IQ, have high values, which shows that the impact of the IQ task on all channels is almost the same. The mean and standard deviation of two channels are shown in Table 1 only for two different conditions, i.e., EO and IQ. The other two channels also have the same type of effect. Moreover, the t-test results of the mean and standard deviation of channels 83 and 75 are mentioned in Table 1. The details of the same parameters for the same channels are shown in Table 2 but for the same brain condition, i.e., IQ.
Table 1: Mean and Standard deviation of two channels 83 and 75 for both conditions along with t-test results.
|
|
Channel 83 |
Channel 83 |
Channel 75 |
Channel 75 |
||||||
|
Mean |
Mean |
Std |
Std |
Mean |
Mean |
Std |
Std |
|||
|
EO |
IQ |
EO |
IQ |
EO |
IQ |
EO |
IQ |
|||
|
Subject 1 |
107.3 |
169.78 |
102.02 |
106.55 |
92.36 |
157.11 |
83.78 |
100.86 |
||
|
Subject 2 |
170.26 |
214.11 |
138.93 |
194.46 |
163.54 |
211.69 |
117.85 |
166.8 |
||
|
Subject 3 |
121.84 |
199.3 |
72.3 |
181.87 |
113.99 |
180.74 |
64.71 |
178.41 |
||
|
Subject 4 |
124.6 |
202.4 |
74.4 |
184.5 |
115.5 |
181.7 |
66.8 |
180.5 |
||
|
Subject 5 |
223.3 |
393.16 |
140.04 |
363.02 |
220.58 |
358.18 |
141.54 |
296.72 |
||
|
Subject 6 |
224.3 |
284.09 |
140.29 |
244.77 |
204.37 |
280.45 |
129.95 |
243.93 |
||
|
Subject 7 |
318.98 |
435.38 |
209.43 |
290.6 |
320.38 |
419.84 |
225.15 |
290.32 |
||
|
t-test result |
0.101 |
0.01942 |
0.12611 |
0.02277 |
||||||
Table 2: Mean, Standard deviation of two channels 83 and 75 for IQ task along with t-test results.
|
|
Channel 83 |
Channel 75 |
Channel 83 |
Channel 75 |
|
|
Mean (IQ) |
Mean (IQ) |
Std (IQ) |
Std (IQ) |
|
Subject 1 |
169.78 |
157.11 |
106.55 |
100.86 |
|
Subject 2 |
214.11 |
211.69 |
194.46 |
166.8 |
|
Subject 3 |
199.3 |
180.74 |
181.87 |
178.41 |
|
Subject 4 |
202.4 |
181.7 |
184.5 |
180.5 |
|
Subject 5 |
393.16 |
358.18 |
363.02 |
296.72 |
|
Subject 6 |
284.09 |
280.45 |
244.77 |
243.93 |
|
Subject 7 |
435.38 |
419.84 |
290.6 |
290.32 |
|
t-test result |
0.7822 |
0.7171 |
||
Discussion
Specifically, the presented research seeks to determine whether changes in various frequency bands occur or not across various activities such as cognitive and baseline (eyes open) tasks. Some prior research [23] has addressed this topic, but the delta band was mostly disregarded in the majority of them. In this research, the behavior of distinct brain oscillations is noticed in the occipital area, namely in the primary visual cortex; nevertheless, the delta frequency band is the major focus of attention. Slow-wave (SW) activities are found in the delta frequency range, which is also essential in comparison to high-wave events, which are found in the alpha and beta frequency bands. The attentiveness of a subject is the most important factor in a slow wave.
In the other method, the mean was calculated along with the standard deviation for each frequency band during both tasks. The difference in the mean and standard deviation between the cognitive task and the baseline was observed. This difference is shown with the help of graphs in Figures 3 and 4 respectively. This figure shows that there is a positive difference from 1 to 7 Hz between the cognitive task and the baseline. This demonstrates that theta and delta frequencies have greater power values for the IQ task when compared to baseline, whereas the power value for alpha and beta frequencies is negative from 8 to 14 Hz, demonstrating that alpha and beta frequencies have greater power during baseline when compared to cognitive tasks. Moreover, the difference is very small compared to the frequency band of 15-20 Hz. The results are consistent with both methods (mean and standard deviation) and for different channels, which analyze the brain activities with two different analysis techniques. In conclusion, it can be said that delta and theta frequency bands have higher values or power during the cognitive task, while in the alpha frequency band the power is reduced. The same patterns were observed in additional brain regions like the parietal and frontal [14]. These frequency bands, i.e., theta and delta, have a key role in brain studies like alpha and beta.
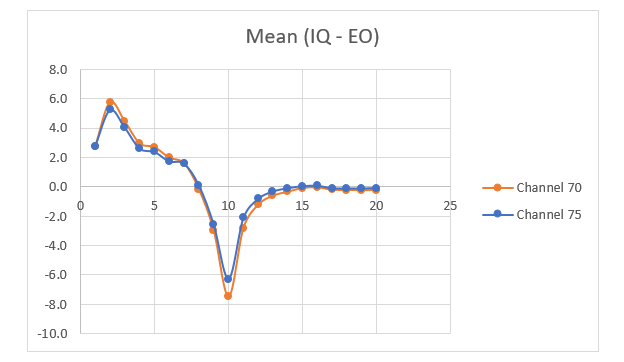
Figure 3: Variance of Mean between Cognitive task and Baseline for two channels.

Figure 4: Variation of Standard deviation between Cognitive task and Baseline for two channels.
Conclusion
Although all frequency bands are important in EEG, the however delta frequency band is also an important band that is ignored in most of the studies for the cognitive task. This frequency band has a changing behavior in different conditions. In one of the studies [24] it is mentioned that this frequency band is also linked with food and sexual arousal activities and delta has a higher value during these types of activities. In our study, it is explained that the theta and delta bands have a significant role during the cognitive task. The results showed that the delta band has a higher value during attention. The frequency range of delta is lower compared to other bands like delta has frequency 0-4; although the frequency is minimum of all bands but is equally significant as in the case of alpha and beta.
REFERENCES
[1] Golonka, K., Golonka, Krystyna Gawlowska, Magda Mojsa-Kaja, Justyna Marek, Tadeusz, Topa, Gabriela, Psychophysiological Characteristics of Burnout Syndrome: Resting-State EEG Analysis. BioMed Research International, 2019. 2019: pp 764-354. DOI:10.1155/2019/3764354
[2] Putman, P., Resting-state EEG delta–beta coherence in relation to anxiety, behavioral inhibition, and selective attentional processing of threatening stimuli. International Journal of Psychophysiology, 2011. vol80, issue1, pp63-68. DOI: 10.1016/J.IJPSYCHO.2011.01.011
[3] Mohamed, A.M.A., et al., Classification of Resting-State Status Based on Sample Entropy and Power Spectrum of Electroencephalography (EEG). Applied Bionics and Biomechanics, 2020. vol2020: pp 853-238.DOI: 10.1155/2020/8853238
[4] Boring, M.J., et al., Continuous decoding of cognitive load from electroencephalography reveals task-general and task-specific correlates. 2020. vol17 issue 5, pp16-56.DOI: 10.1088/1741-2552/abb9bc
[5] Zhao, J., et al., Analysis of complex cognitive task and pattern recognition using distributed patterns of EEG signals with cognitive functions. 2020: pp 1-10. DOI: 10.1007/s00521-020-05439-9
[6] Kongwudhikunakorn, S., et al., A Pilot Study on Visually Stimulated Cognitive Tasks for EEG-Based Dementia Recognition. 2021. vol70: pp1-10.
[7] Montilla-Trochez, Daniela ; Salas, Rodrigo ; Bertin, Alejandro ; Griškova-Bulanova, Inga ; Lisboa, Paulo ; Saavedra, Carolina, Convolutional neural network for cognitive task prediction from EEG’s auditory steady state responses. in Proceedings of the 5th Congress on Robotics and Neuroscience, February 27-29, 2020, Valparaíso, Chile. 2020. CEUR-WS. p. 44-50
[8] Zafar, Raheel, Malik, Aamir S.Amin, Hafeez Ullah, Kamel, Nidal, Dass, Sarat, Ahmad, Rana Fayyaz, EEG Spectral Analysis during Complex Cognitive Task at Occipital. 2014 pp 907-910, DOI: 10.1109/IECBES.2014.7047643.
[9] Duan, W., et al., Reproducibility of power spectrum, functional connectivity and network construction in resting-state EEG. Journal of Neuroscience Methods, 2021. vol348: pp108-985. DOI: 10.1016/j.jneumeth.2020.108985
[10] Friedman, N., et al., EEG-based prediction of cognitive load in intelligence tests. 2019. vol 13 issue:1 p. 1-91. DOI: 10.3389/fnhum.2019.00191
[11] Klimesch, W., EEG alpha and theta oscillations reflect cognitive and memory performance: a review and analysis. Brain research reviews, 1999. vol29, issue 2 pp 169-195. DOI: 10.1016/s0165-0173(98)00056-3
[12] Babiloni, C., et al., Pre-and poststimulus alpha rhythms are related to conscious visual perception: a high-resolution EEG study. Cerebral cortex, 2006. vol16, issue 12 pp 1690-1700. DOI: 10.1093/cercor/bhj104
[13] Knyazev, G.G., D.J. Schutter, and J. Van Honk, Anxious apprehension increases coupling of delta and beta oscillations. International Journal of Psychophysiology, 2006. vol61, issue 2: pp 283-287. DOI: 10.1016/j.ijpsycho.2005.12.003
[14] Harmony, T., et al., EEG delta activity: an indicator of attention to internal processing during performance of mental tasks. International journal of psychophysiology, 1996. vol24, issue 1: pp 161-171.
[15] Jensen, O., et al., Oscillations in the alpha band (9–12 Hz) increase with memory load during retention in a short-term memory task. Cerebral Cortex, 2002. vol12, issue 8 pp 877-882. DOI: 10.1093/cercor/12.8.877
[16] Knyazev, G.G., EEG delta oscillations as a correlate of basic homeostatic and motivational processes. Neuroscience & Biobehavioral Reviews, 2012. vol36, issue 1 pp 677-695 DOI: 10.1016/j.neubiorev.2011.10.002.
[17] Pathania, A., et al., Exploring the reliability and sensitivity of the EEG power spectrum as a biomarker. International Journal of Psychophysiology, 2021. vol160, issue 1 pp 18-27. DOI: 10.1016/j.ijpsycho.2020.12.002
[18] Prada, L., et al., EEG delta oscillations index inhibitory control of contextual novelty to both irrelevant distracters and relevant task‐switch cues. Psychophysiology, 2014. vol51, issue 7 pp 658-672. DOI: 10.1111/psyp.12210
[19] Raghavachari, S., et al., Theta oscillations in human cortex during a working-memory task: evidence for local generators. Journal of Neurophysiology, 2006. vok95, issue 3 pp 1630-1638. DOI: 10.1152/jn.00409.2005
[20] Moran, R.J., et al., Peak frequency in the theta and alpha bands correlates with human working memory capacity. Frontiers in human neuroscience, 2010. vol4: pp. 200. DOI:= 10.3389/fnhum.2010.00200
[21] Jim Lagopoulos 1, Jian Xu, Inge Rasmussen, Alexandra Vik, Gin S Malhi, Carl F Eliassen, Ingrid E Arntsen, Jardar G Saether, Stig Hollup, Are Holen, Svend Davanger, Øyvind Ellingsen, Increased theta and alpha EEG activity during nondirective meditation. The Journal of Alternative and Complementary Medicine, 2009. vol15, issue 11 pp 1187-1192. DOI: 10.1089/acm.2009.0113
[22] Raheel Zafar, Muhammad Noman Malik, Huma Hayat, Aamir Saeed Malik, Decoding Brain Patterns for Colored and Grayscale Images using Multivariate Pattern Analysis. 2020. vol14, issue 4) pp 1543-1561 DOI:10.3837/tiis.2020.04.008.
[23] E Başar 1, C Başar-Eroglu, S Karakaş, M Schürmann, Gamma, alpha, delta, and theta oscillations govern cognitive processes. International Journal of Psychophysiology, 2001. vol39, issue 2 pp 241-248. DOI: 10.1016/s0167-8760(00)00145-8
[24] Knyazev, G.G., Motivation, emotion, and their inhibitory control mirrored in brain oscillations. Neuroscience & Biobehavioral Reviews, 2007. vol31, issue 3 pp 377-395.
 |
Copyright © by authors and 50Sea. This work is licensed under Creative Commons Attribution 4.0 International License. |


