
River Profile Modeling Through Surface Deformation Using RS/GIS, A Case Study Swat River
Hafsa Amen1, Syed Amer Mahmood1, Saira Batool2, Areeba Amer5, Mareena Khurshid3, Sadia Sadiq1, Sajjad Ali Gill4
1 Department of Space Science University of the Punjab Lahore.
2 Centre for Integrated Mountain Research (CIMR) University of the Punjab Lahore.
3 Department of Geography University of the Punjab Lahore.
4 Department of Sports Science University of the Punjab Lahore.
5 Wuhan University China.
* Correspondence: Marina Khursheed and Email : marinakhurshid@gmail.com
Citation | Amen.H, Mahmood.S.A, Batool.S, Amer.A, Khursheed.M, Sadiq.S, Gill S.A., ”
River Profile Modeling Through Surface Deformation Using RS/GIS, A Case Study Swat
River” International Journal of Innovations in Science & Technology, 2020 Vol 2 Issue 3 PP
75-88
Received |Aug 11, 2020; Revised | Sep 08, 2020; Accepted | Sep 09, 2020; Published | Sep
10, 2020.________________________________________________________________
Abstract.
The objective of this appraisal is to determine the feasibility of dam sites in Swat Valley and its peripheries (Northern Pakistan). We exploited SRTM DEM with a spatial resolution of 90m to extract various geomorphic indexes for the dam site feasibility. This research aims at pinpointing areas which can be opted for small dam constructions to overcome the electricity crisis in Pakistan to some extent to meet the national electricity
needs. We exercised River profile analysis (RPA), D8 flow popular algorithm, Concavity, Steepness, and Hack-gradient methods to prepare interpolated maps for the Steepness index, Concavity index, Relative uplift rates, and other parameters like value zoom, vector zoom, surface zoom, density zoom, relief zoom and contour map. The drainage pattern of this area indicates that there are high relative uplift rates, erosion, steepness and concavity in NE, NW and SW. The DEM based RPA develops as much easier and faster approach to demarcate sites influenced by neotectonics.
Keywords: Natural Disasters, Pre and Post Flood, Landuse, Land cover.
Introduction
Flood risks in urban areas have been increased in recent years due to population growth and increased economic activities [1]. Flood risks should be identified, assessed and managed properly by using reliable and appropriate measures. Traditionally, the river stages and flood flows are modeled by using one dimensional hydrodynamic model due to their low cost and scarce field data requirement. Complex river and hydraulic systems such as bridge pier are efficiently represented by these models [1,2]. However, these models are not
appropriate and accurate for representing the river stages and flood flows [3]. The 1D model can appropriately represent the river shapes. Chen et al. [4]determined that 1D hydrodynamic models have some limitations and cannot represent the topography, river bathymetry and also inappropriate to represent the conditions of complex hydrodynamic river systems[5,6]. Therefore, the two- or three-dimensional models are proposed to overcome the limitations. Although 2D and 3D models successfully represent the river processes, their precise application depends upon the accurate representation of river bathymetry [7]. The 2D and 3D models contain bathymetric data extracted by the cross sectional observation of elevations residing at the nodes of finite element mesh model [8,9,10]. Spatial bathymetric data has been used in many researches for the simulation of models. The ability of spatial prediction techniques to assume unmeasured area using discrete data defines the accuracy of bathymetric representation of 2D or 3D models[4,11,12]. These spatial prediction techniques include splines, Inverse Distance Weighting (IDW), triangulation, and Kriging [13]. The river topography cannot be predicted if there exists anisotropy in measured cross-sectional data of river systems. In order to generate missed data between cross sections, Beasley et al. introduced an algorithm [3]. This algorithm needs a cubic Hermite spline to produce a river bed which contains morphological characteristics[3,7,14,15]. Fluvial stage simulation of 2D and 3D model requires large amount of topographic and bathymetric data. In order to accurately predict unmeasured areas, appropriate interpolation methods are required. Morphodynamic models of river stage and sediment transportation requires hypsometry techniques to generate Digital Terrain Data (DTM) [8,16]. Dry areas of river can also be explained using LiDAR techniques. As the Airbone LiDAR techniques have some limitations, bathymetry surveys or SONAR techniques which are used as an alternative of LiDAR technique. SONAR techniques are used to obtain cross sectional river data. In order to produce a smooth bathymetry in the flow model, many researchers proposed an algorithm for sparse cross sectional river measurement. The river cross sectional data extraction in longitudinal and transverse directions can be done using following three algorithms which are Natural Neighbor (NN), linear interpolation and Inverse Distance Weighting (IDW). In 2D model, the observed and simulated water stages are compared using three algorithms along the original and resampled cross section data. The river stages were simulated using 3D model by obtaining resampled cross sectional river data on the basis of linear interpolation method during high and low flow conditions in the river Tsengwan. The conclusions were drawn after sensitivity analysis of vertical eddy viscosity and drag coefficient under linear interpolation method based on 2D and 3D models. Tectonic Geomorphology Tectonic geomorphology describes the relation of tectonic activities and erosional processes with geomorphic features. The tectonics uplift of spatial patterns is related to the platform changes. Gurnis [17] proposed discrete uplift and different stages of landscape give rise to mountain belts. Subsequently, Hager [18] suggested a model for the development of landscape which shows the response of surface topography to a period of relative uplift and sustained waxing. It is stated that the lithospheric strength and erosional procedures limit the growth of surface topography [19]. Tectonic and Climatic Forcing of River Incision
Changes Stream Geomorphology
Dynamic equilibrium will be established in the river system after disturbance. After channelizing or removal of alluvial material the stream will deteriorate its natural state. After deterioration water quality will be reduced while erosion and sediment transportation will be increased. Thus, continual maintenance is required to control the natural state deterioration of stream.
Changes in stream profile are triggered by extracting alluvial materials from the stream bed. When the balance between the supply of sediment and sediment carrying capacity of streams is disturbed by the changes brought to flow regime, the stream bed is eroded and the channels deepen in the stream bed.
At a point in the stream bed, velocities of flow increase because of steeper gradient creating a Knick point. The Knick points will move upstream by a process called head cutting when the increase in flow velocities erode the stream bed. The movement of Knick point continues until the stream gradient stabilizes. Large amount of stream sediments is released, transported and deposited in downstream by head cutting. The form of channel is changed by deposition of stream sediments in deep holes of stream. As the cross-sectional
area of channel increases, its flow capacity is also increased which effects the movement of
sediments.
The energy dissipation of larger floods across the plain is low as they are restrained in the modified channels. Thus, the stream energy during flood is increased which cause erosion, increases transport and supply of sediments. The stream banks collapse due to deepening of stream bed which increases stream height that led to collapse and erosion. Extensive collapse of river banks widens the streams which increases its flow capacity,
transport and supply of sediments downstream. When the gravel is removed from the stream bed, the materials liable to erosion are exposed by bars of river. This causes excessive scouring and movement of bed sediments which causes removal of materials and loss of stream roughness. Removal of materials including boulders and woody debris may reduce health of ecosystem and structural integrity
of stream.
Flood carrying capacity of stream is increased by channelizing, which can result in unintentional erosion downstream and upstream of a channel. The velocities of flow are also increased by increasing the slope. Sudden changes in the slope can cause degradation and erosion of the channel upstream, and aggradation of the channel downstream. The importance of increased flow velocities is dependent upon the river banks, the bed and the condition of the riverine vegetation cover. The materials such as gravel and cobbles provide
resistance to erosion and the riverine vegetation also decrease the chances of erosion by decreasing the flow velocities. The increasing flow velocities and flow volumes may destabilize the river banks and can trigger many other changes in profiles of stream. Stream flow affects the surface and ground water and can trigger changes in local hydrology which can cause unintended changes in water flow. The removal of stream gravel and alluvial substance may cause reduction of bank storage, lowering of water table, drainage of associated wetlands, variations in stream flow and uniform stream state.
Channelizing
The flow velocity and capacity can be increased by smoothing and flattening of river banks. The straightening of river banks may have following outcomes:
•Flood flow is increased downstream by increasing flow velocities.
• Greater water flow may cause unintentional changes in stream course.
• Improved drainage of land near stream can cause reduction of water in stream
during dry season.
Stocks of soil left on flood plain may trigger changes in hydraulics of stream during flood.
▪ Modified slope of stream after cut-off
▪ Natural slope of stream.
▪ Stream flow
▪ Downstream sediment deposition
▪ Sediment extraction
▪ Bed erosion moves upstream
▪ Stream flow
▪ Natural stream channel
The diversion of channel will decrease the length of channel increasing the slope of stream which causes head cut erosion and increased flow velocity.
Damages infrastructure
Excavating of the stream causes erosion which may harm private and public properties. Utility lines and submerged pipelines may be exposed and bridge piers may get eroded by channel incision. Downstream flood aggravation may elevate the risk of destruction of flood protecting structures and infrastructure.
Increased sediments supply and transport downstream by excavating the streams may demean stock and domestic water transportation. Sediment input or runoff from nearby lands may be triggered by a new channel course. Excessive quantity of nutrients, pesticides and salts are discharged into the stream by agricultural lands runoff.
Reduces recreational and aesthetic values
Increased sediments and pollutants that are visible in water may reduce recreational activities including swimming, fishing and bird watching because these activities require pollution free clean water. Landforms and vegetation covers must be preserved to conserve the aesthetic values of stream.
Study area
Swat is a valley and district located in the province of Khyber Pakhtunkhwa. It is known for its outstanding and tremendous beauty. During the visit of Queen Elizabeth, this place was named as the Switzerland of the East. Swat was a Buddhist district and early it was a part of the Gandhara district which is self-grooming district with the total population of 2309570 according to 2017 census. Swat is comprised with cooler and wetter climate
condition with the average elevation of about 980m. Swat lies between the foothills of Hindukush mountain range between 34°-40′ to 35° N latitude and 72′ to 74°-6′ E longitude. Swat has major intentional importance as it is located in the region where central Asia, south Asia, china meets and it is the part of North Frontier province of Pakistan. The altitude of swat valley is 975.36m to 2900m and is located 257 kms to NW of Islamabad territory and 176 kms to NE of Peshawar. In Sawat valley, Falak Sher/Sar peak is the highest peak of Hindu Kush range which is of 5918 meters. The Swat peak point is in Tirich Mir (7,708 m) in Chitral District. The peak point of swat is located in Tirich Mir at 7,708m in district Chitral. The peak point of swat divides the Amu Darya valley from north to south from Indus river valley. It runs to swat buttresses in the East to a point where Pakistan, Afghanistan and China borders meet known as Pamir range. Finally, it merges into western minor ranges of Afghanistan moving through the Southeast part of Pakistan.
The mountain ranges of the Swat reveals a general trend, as it stretch westward, and extend from 4,500 to 6,000 meters (14,700 feet to 19,100 feet), near Kabul (in the middle). These ranges attain the height of 3,500 to 4,000 meters (11,500 feet to 13,000 feet). The average altitude of Swat is 4,500 meters (14,700 feet which stretches about 966 kms (600 mi) laterally; with its 240 kms (150 mi) median north-south measurement. Swat Mountains covers only 600 kms (370 mi) of entire Swat ranges mapped in Figure 1.
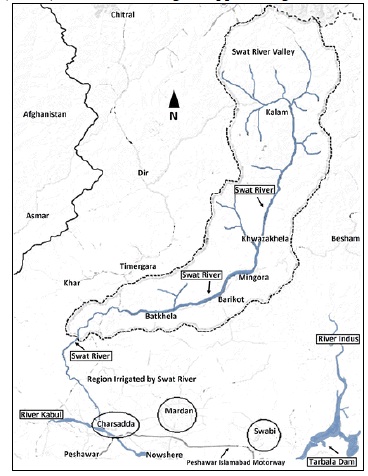
Figure 1. Swat River
Swat Seismology
In context of seismicity, the most active regions of Swat system lies along the boundaries of NW Pakistan, far NE Afghanistan, and Tajikistan. As the activities of subduction of oceanic lithosphere are rare, therefore oceanic lithospheric subducted with seismic activity of compression depth (70-300km). The most dynamic region of compression depth seismicity is associated with the Pamir-Hindukush central Asia Swat region and these dynamic regions are not clearly linked with the progressing subduction of lithosphere. In the
past, many seismologists explored the Swat region as mapped in Figure 2.
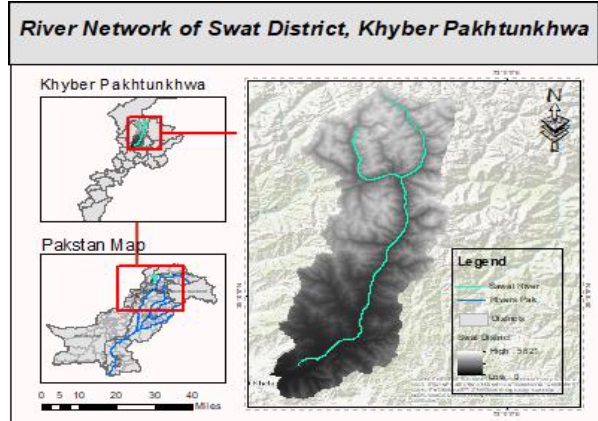
Figure 2: Map of Swat District, Khyber Pakhtunkhwa Province of Pakistan Swat River
Swat river is known as a Persistent river located in the northern area of province Khyber Pakhtunkhwa. The river starts from the region Swat Kohistan and flows downstream in a narrow ravine up to Baghdheri with convergence of Ushu and Gabral tributaries. The major streams of swat river such as Gabral and Ushu Gols also changes its gradient at many places and this change is not only due to some mountains but due to a high
quality Alluvial fans. As these tributaries fed by the glaciers water flow through the Kalam valley with a rushing speed in a narrow valley up to Madyan and lower plain areas of Swat valley up to Chakdara. The ruptures in tectonic plate are mapped in Figure 3.
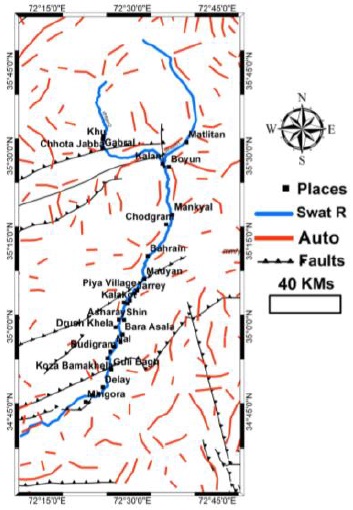
Figure 3. Fault map of study site.
MATERIAL AND METHODS
Neo-tectonic activity in Swat ranges is determined using remote sensing data.
Data Acquisition and Processing:
Essentially two sorts of datasets are utilized to map dynamic surface deformation in Swat. This datasets contains the Sentinel-2 and SRTM Digital Elevation Model data.
Stream definition and Segmentation
Stream segmentation defined the how smaller the stream network allows for the assigning of the same unique value to stream cells situated within the same stream segment.
Watersheds Delineation and Polygon Processing
In watershed delineation model, the grid processor needs following grid layers: sink points, flow accumulation, and flow direction. Basically, it is grid catchment area draining into each stream segment. The watershed delineation helps us to identify the area with minimum and maximum flow. It is done by drawing lines on a map to identify a watershed's boundaries. These lines are drawn using information of contour lines.Longitudinal Profiles of River:
Geomorphological analysis of river systems should consider landforms associated with river dynamics in complete hydrographic context. It means, the simplest morphological expression that contains the greatest amount of information is the longitudinal profile of the river. The procedure will create a line of flow over a river channel of DEM, generate a profile for the vector set and apply a statistical process to remove topographic errors.
D8 algorithm is used to find flow directions of topographic plan. This method highlights "flow" of each pixel along one of its eight native pixels, it demonstrates that D8 method requires DEM technique to extract stream method without any depression. Flow patterns in planes are analyzed by “Imposed gradients” method. The most supporting is D8 grid as it gives vector data as output. The output vector extracts data from a single or many dislodged basins. Outlet pixel include all pixels for a specific basin. All these basins have a variety of attributes to contribute a particular region. First one encounter attributes for all channels links in the river network while second one is a stream file that encounters attributes for every stream in the river network system. Finally, drainage area grid is created to calculate concavity.
Calculation of Concavity and Steepness
The stream model explains detachment-limited incision which occurs in bed rocks. The calculation depends upon this model. Area drainage and gradient of channel is determined using Power law.
dz / dt = U(x,t) – K Am Sn Eq……..……… 1
In the above equation,dz/dt shows the variations inrate of change of channel’s elevation. U represents the rock uplift rate comparative with fixed foot level. The symbol A states upstream area, K is the dimensional coefficient of erosion, S shows the value of gradient of channel at local level and the values of m and n remain positive in contrast with the hydrology of basin and the erosions. If this condition is analyzed as Steady - State (dz / dt = 0), taking U and K uniform and taking m and n as constants, the equation (1) can be
resolved into an equilibrium expression.
S = (U/K) 1/n A –(m/n) Eq. ………………. 2
Equation 2 represents the relationship between Power and Law to determine the
channel gradient and drainage area for natural landscapes:
S=ksA-θ Eq.……………….3
Here the coefficient (U / K )1/n is steepness of channel, the values of ks and the ratio m/n is the essential channel concavity that is equals to the actual concavity θ by taking uniform K, U, m, and n. Taking Log on both sides of the equation 3 we get:
logs = - θ log A+ log ks Eq. ………………..4
In equation 4, the concavity θ, steepness ks and the regression is – θ also the
intercept is logks.
Results and Discussions
The interpolated concavity map is shown in Figure 4.
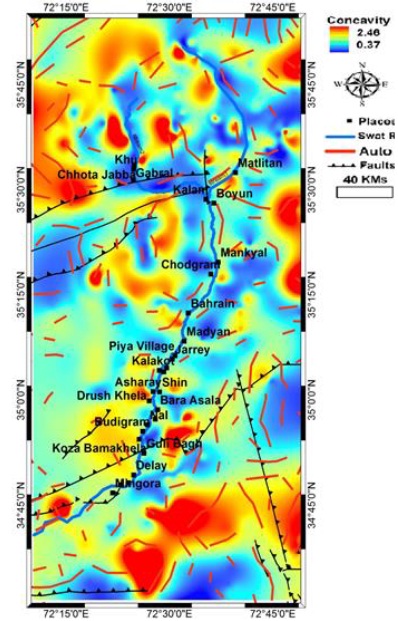
Figure 4. Interpolated concavity map for Swat valley and surroundings. Thick black lines
with teeth symbols show published geological faults and red lines show SRTM DEM based
automatically extracted faults.
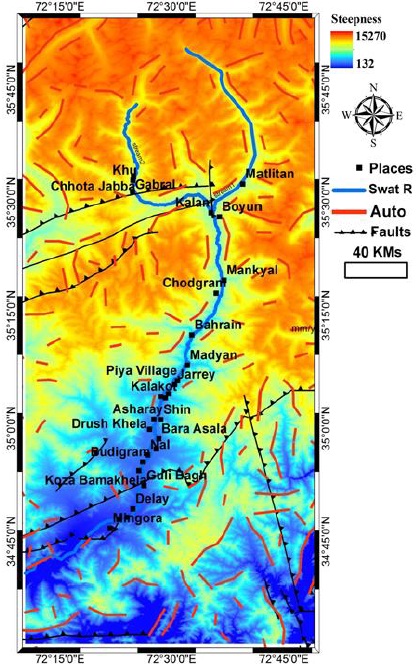
Figure 5. Interpolated steepness map (Ks) for Swat valley and surroundings.
The northern side is highly steep therefore the pressure of water flow is very fast
which move sediments and raw material leading to high pressure of erosion and incision.
Steepness is less in southern region which is showing gentle slopes therefore this situation
leads to less erosion/incision.
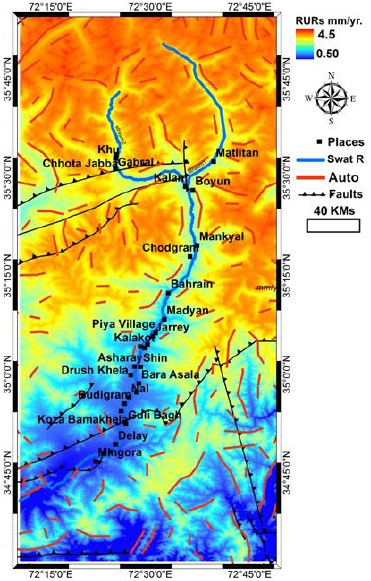
Figure 6. Relative uplifts rates of Swat Basin
Figure 6. Map showing relative uplifts rates of Swat Basin, reddish orange part of the map is dominated by the regional uplift in the context of India Eurasia collision and it is upper swat. While lower swat below Mingora is showing lesser uplift rates but still in the south corner, there is cluster of lineaments along the Main Mantle Thrust (MMT) which is a neotectonics.
Topographic development of Swat valley and the relative uplift is demonstrated using geomorphometric maps and indices. The concavity and steepness of the stream are analyzed using stream profile analysis and incision detachment model which showed 236 large and small streams originated from the region. Steepness and concavity index values were described by regression model to carry slop and stream profile analysis. Non
equilibrated profiles specify relative reinforcement of waterway triggering the incision, narrowing, and erode neotectonics components which in turn represent Knick points glided by stream enforcement forces. The concavity index map shows that, the effect of erosion is more dominating in Gabral valley, Ushu valley, Chhota Jabba, between madayan and Mangora and towards the Shangla Pass along the syntax which is situated south east of Mangora, on the south east of MMT (Main Mantle Thrust). Thus, the low concavity index, high uplifts and disturbed profiles are shown by the streams located in this region which indicate surface smoothness and activeness. Likewise, the upstream of Swat river starting from Madayan till upper swat and NW and NE of Gabral River and Ushu have relatively higher uplift rates. Due to this reason, the local topography has been pushed many kilometers away by the greatest shear zone which is located near NNE of the MMT and
northern Dir Thrust. Stream profile analysis was performed for 116 streams. A demonstration of stream 1 is shown in Figure 7.
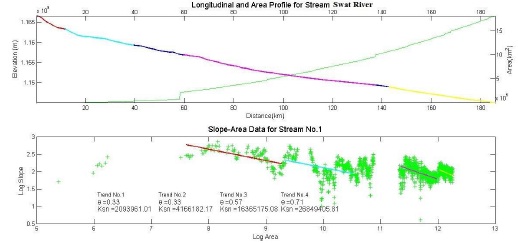
Figure 7. Stream profile analysis.
Conclusions:
The automated drainage network based on DEM is an important tool for computerbased analysis of stream profiles as it gives information about the landscape and surface deformation in the study area. The Soan River exhibits a change in the course of its behavior which is related to the neotectonics and underneath lithologies of the Potwar Plateau. The relative uplift rate map of the study area indicates that Swat Valley is deformed
tectonically more (higher uplift) in upper half as compared to the Lower half. The Geomorphometric features are important and effective indicators for neotectonic studies in a young tectonic regime with low elevation. SRTM DEM-based isobase technique has been quite useful, quick and efficient technique for the morphotectonic investigation. Isobase maps permit the quick, delineation, recognition and orientation of neotectonics that present either poor or very less exposed expressions on the thematic maps.
Author’s Contribution. All authors contributed equally.
Conflict of interest. Authors declare no conflict of interest for publishing this manuscript
in IJIST.
Project details. Nil
REFRENCES
- Arnold, J.G., Srinisvan, R., Muttiah, R.S., Williams, J.R., Large area hydrologic modeling and assessment. Part I: model development. J. Am. Water Resour. Assoc. Vol 34, issue 1, pp:73–89, 1998.
Arnold, J.G., Muttiah, R.S., Srinivasan, R., Allen, P.M., Regional estimation of base flow and groundwater recharge in the upper Mississippi River basin. Vol 227, issue 1, pp: 21–40, 2000.
3. Beasley, D.B., Huggins, L.F., Monke, E.J., ANSWERS: a model for watershed planning. Trans. ASAE , Vol 23, issue 4, pp: 938–944, 1980.
4. Chen, J.Y., Adams, B.J., Integration of artificial neural networks with conceptual models in rainfall-runoff modeling. J. Hydrol. Vol 318, pp: 232–249, 2006.
5. Dawson, C.W., Wilby, R.L., Hydrological modelling using artificial neural networks. Prog. Phys. Geog. Vol 25, pp: 80–108, 2001.
6. De Roo, A.P.J., Wesseling, C.G., Ritsema, C.J., LISEM: a single event physically based hydrological and soil erosion model for drainage basins: I. Theory, input and output. Hydrol. Vol 10, pp: 1107–1117, 1996.
7. Bell, T. H. Statistical features of sea-floor topography. Deep Sea Research, Vol 22, pp; 883–892, 1975.
8. Birnir, B., Smith, T. R., & Merchant, G. E. The scaling of fluvial landscapes. Computers & Geosciences, Vol 27, pp: 1189–1216, 2001.
9. Memoir - Geological Society of America, 201, 66. Chase, C. G. Fluvial landsculpting and the fractal dimension of topography. Geomorphology, Vol 5, pp: 39–57, 1992.
10. In P. R. Wilcock & R. M. Iverson (Eds.), Prediction in Geomorphology, Geophys. Mono, Vol. 135, pp. 103–132, 2013.
11. Durand, M., Gleason, C. J., Garambois, P. A., Bjerklie, D., Smith, L. C., Roux, H., et al. An intercomparison of remote sensing river discharge estimation algorithms from measurements of river height, width, and slope. Water Resources Research, Vol 52, pp: 4527–4549, 2016.
12. Fishwick, S. Surface wave tomography: Imaging of the lithosphere-asthenosphere boundary beneath central and southern Africa?, Vol 120, pp: 63–73, 2010.
13. Gallant, J. C., Moore, I. A., Hutchinson, M. F., & Gessler, P. Estimating fractal dimension of profiles: A comparison of methods. Mathematical Geology, Vol 26, issue 4, pp: 455–481, 1994.
14. Giresse, P., Hoang, C.-T., & Kouyoumontzakis, G. Analysis of vertical movements deduced from a geochronological study of marine Pleistocene deposits, southern coast of Angola. Journal of African Earth Sciences, Vol 2, issue 2, pp: 177–187, 1984.
15. Goren, L., Fox, M., & Willett, S. D. Tectonics from fluvial topography using formal linear inversion: Theory and applications to the Inyo Mountains, California. Journal of Geophysical Research: Earth Surface, Vol 119, pp: 1651–1681, 2014.
16. Guiraud, M., Buta-Neto, A., & Quesne, D. Segmentation and differential post-rift uplift at the Angola margin as recorded by the transform-rifted Benguela and oblique-toorthogonal-rifted Kwanza basins. Marine and Petroleum Geology, Vol 27, pp: 1040–1068, 2010.
17. Gurnis, M., Mitrovica, J. X., Ritsema, J., & van Heijst, H.-J. Constraining mantle density structure using geological evidence of surface uplift rates: The case of the African superplume. Geochemistry, Geophysics, Geosystems, Vol 1, pp: 1020, 2000.
18. Hager, B. H., & Richards, M. A. Long-wavelength variations in Earth's geoid: physical models and dynamic implications. Philosophical Transactions of the Royal Society London A, Vol 328, pp: 309–327, 1989.
19. Hancock, G. R., Martinez, C., Evans, K. G., & Moliere, D. R. A comparison of SRTM and high-resolution digital elevation models and their use in catchment geomorphology and hydrology: Australian examples, Earth Surf. Processes Landforms, Vol 31, pp; 1394–1412, 2006.


