
SRTM DEM based Neotectonics from Non-Linear Analysis: A Paradigm through Fractal Analysis
Areeba Amer1*, Syed Amer Mahmood2, Amer Masood3, Saira Batool4, Hania Arif5, Bushra Talib5, Muhammad Shahazad6, Rana Muhammad Sohail Aslam7
1 Wuhan University China.
3,4Center For Integrated Mountain Research (CIMR), University of the Punjab, Lahore.
2,7 Department of Space Science, University of the Punjab, Lahore.
4,5College of Earth and Environmental Sciences (CEES), University of the Punjab, Lahore
5Department of Technology & engineering, University of the Lahore.
6 Department of Computer Science (PUCIT), University of Punjab
* Correspondence: Areeba Amer ( areebaamer001@gmail.com)
Citation | Amer. A, Mahood. S. M, Masood.A, Batool.S, Arif. H, Talib. B, Shahzad. M, Aslam. S. R.M “SRTM DEM based Neotectonics from Non-Linear Analysis: A Paradigm through Fractal Analysis”. International Journal of Innovations in Science & Technology, Vol 03 Issue 01: pp 43-51, 2021.
Received |Feb 08, 2021; Revised | Feb 22, 2021; Accepted | Feb 25, 2021; Published | Feb 28, 2021.
________________________________________________________________________
Abstract
Neotectonics amend the river base and causes landscape erosion. This study explores the DEM based differentiation of neotectonics in the northern regions of Pakistan. This method involves vertical and non-linear dissection base on digital evaluation method. This study uses Gliding Box Technique (GBM and GBT) and Box Counting method to evaluate Lacunarity (LA), Succolarity (SA) or 3-Fractals, and Fractal Dimensions (FD). 3-fractals are an attribute used for the recognition of spatial patterns, specifically to compute and differentiate natural textures including natural patterns. This study also investigates vertical dissection using DEM SRTM having spatial resolution of 90m. DEM SRTM measures surface area, plane area as well as the surface ratio. The vertical areas are investigated to make dissection maps and to identify the affects of neotectonics on the roughness of surface. Low value of surface roughness indicates flattened drainage basins and inclination of slope. The Raikot Fault shows higher values of surface roughness towards NE- SW. The surface roughness is mapped to recognize relative uplifts, uneven regions, depressions and pits. Analysis through non-linear method identifies the regions affected by neotectonics activity. Tectonics activity causes deformation and instability in drainage networks.
Keywords: surface roughness, Gliding Box Technique, Fractal Dimension, SRTM DEM, Succolarity.
Introduction
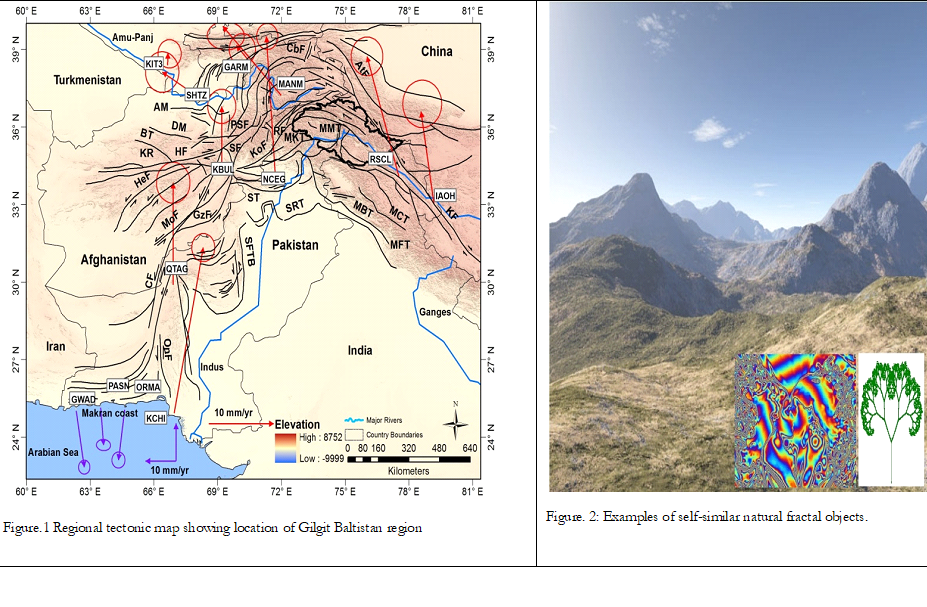
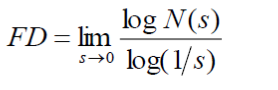
The current topography of Gilgit-Baltistan is a consequence of continuous climatic changes and tectonic activity. Digital evaluation model is used to analyze spatial distribution patterns of drainage network. This study deals with the fractal analyses of drainage networks. The fractals are self-identical complex objects which can be reduced to small size parts identical to the whole [1]. In nature, fractals occur in form of branches of trees, patterns of drainage network, river system and human circulatory system. The developing patterns of fractals can be explained through physical and geological activity. The fractal dimension analysis has wide applications in the field of forestry, food research, landscape ecology, tectonic geomorphology and information technology [2]. Figure 1 and 2. Shows the regional tectonics and self similar fractal objects respectively.
Lacunarity is a method used to represent the stream network in form of texture. This method accurately differentiates patterns having corresponding values of fractal dimension. The LA monitors varying self-identical conduct of fractals and its low value indicates low activity [4]. The Secularity monitors the instabilities of spatial drainage patterns. Secularity method monitors the black and white imagery perpendicularly and prospectively to monitor the infiltration capability [5]. The succolarity method determines the common rotator method of spatial drainage patterns. Its high value indicates highly deformed regions. The objective of this paper is to identify and interpret data of natural drainage networks [6].The main objective behind these methods is to recognize instability and variations in natural spatial patterns. Geomorphologically, asymmetrical, linear and spatial drainage patterns show the instabilities caused by geological processes. Active deformations of surface can be studied by examining the stream patterns. The deformation due to tectonic activity adjusts the spatial drainage patterns into linear configuration [3].
Data and method
SRTM with 90m resolution was used to extract drainage patterns using black and white imagery. Neotectonics strongly impact surface deformation and development of landscape due to which streams display strained and linear pattern [7]. Fractal box counting technique was used in this research to display complex drainage patterns. But the fractal dimension is important to display interpretation of spatial patterns. Thus, to interpret drainage networks SA and LA methods are utilized [8].
Fractal Dimension and Box Counting Method
Fractal objects are uniform and unvarying entities. The fractal entities are self identical and homogenous objects used for determination of geomorphic indices [9]. The drainage network displays fractal like homogenous properties. Fractal dimensions determine the segmentation and deviation extent of spatial drainage patterns. This study determines the fractal dimension of Hunza, Indus and Gilgit River and computes drainage network for Gilgit-Baltistan [10]. Fractal dimensions can be computed using Box Counting method using binary pictures of variable sizes that adds up the total drainage pixels lying in a box. The square size “s” and the number of pertinent boxes “N(s)”are summed in a grid. Equation 1 shows the computation of FD:
Equation.1
The total number of boxes is given by N(s) and “s” represents the size of the box side (Figure 3). The FD is represented by the slope regression of the natural log (ln) graph of total number of boxes and 1/s. The ramp color was used in FD spatial distribution map to recognize low value of FD. Generally, fractal values of spatial distribution patterns display linear images of spatial distribution pattern. Figure 3. Shows the value of FD up to 1 displays high linearization of stream networks.
Lacunarity and Gliding Box Technique (GBT)
The lacunarity is a method used to investigate varying behavior of fractal objects. The lacunarity accurately analyzes the distribution of spatial drainage networks and gaps among entities of a network [11]. The lacunarity method can also differentiate the contrary patterns of drainage network having similar fractal values [12]. The Gliding Box Technique (GBT) computes Lacunarity. (Equation.2)
Equation.2
The homogenous fractal objects have low value of Lacunarity while heterogeneous fractal objects have high Lacunarity value. The high LA values indicate distorted drainage patterns while low LA values indicates low tectonic activity. LA values higher than 2.5 indicates sever deformation.
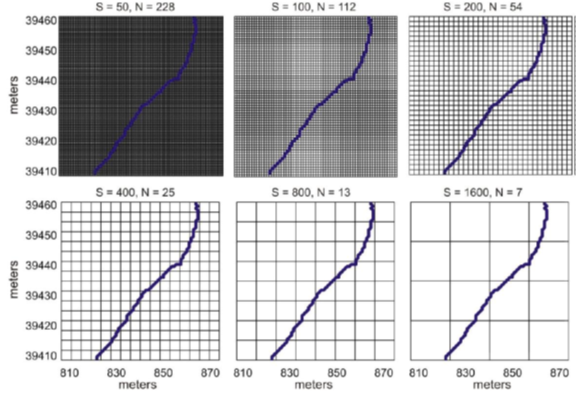
Figure 3. Calculation of Fractal Dimension (FD) by using Box counting method.
Succolarity fractal
The Succolarity method is used to calculate percolation capability of binary images. The image which is analyzed provides direction of more images.
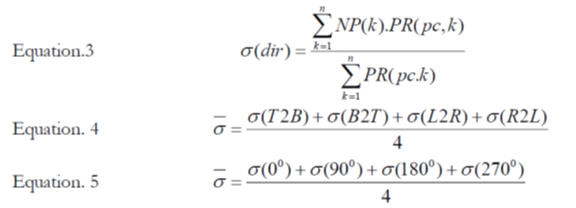
The SA value ranging from 0 to 1 is catogrized as < less than 0.5 is low, 0.5 to 0.75 is medium and greater than 0.75 is high SA value. High Succolarity value represents distant drainage and indicates tectonic activity [13, 14, 15]. It also displays regions of active deformation due to impenetrable masses and empty gaps. Figure 4. Indicates flooded scenarios through blue boxes.
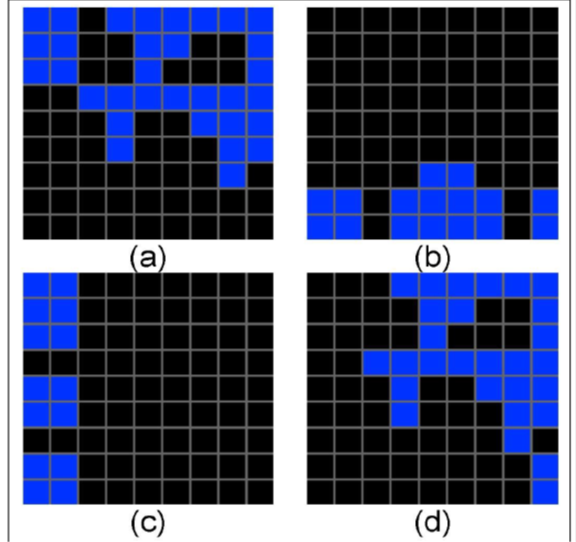
Figure 4. Pictures taken after performing the SA. Blue boxes represent the flooded scenario; (a) (T2B); (b) (B2T); (c) (L2R); (d) (R2L).
Results and discussions
Geometric change in local as well as regional faults affects the tectonically active drainage systems. The entire drainage network of northern regions of Pakistan is under the influence of neotectonics activity. The drainage network analysis method can monitor active tectonic signals which cause erosion and surface deformation. The drainage network is spatially distributed in four classes which include branched, parallel, cut off and rectangular drainage systems. The geometric transitions in different phases of spatial drainage system occur due to tectonic activity, geological factors, climatic changes and spatio temporal method. The tectonic activity dominates in highly steep regions resulting in parallel drainage patterns. The relative uplift of topography of a region results in linear drainage patterns due to tectonics uplift. Different fractal methods such as LA, SA and FD determine the undisturbed fractal patterns. Figure 5, 6 and 7 shows different values of FD, LA and SA respectively. The low value of FD indicates erosion processes and relative tectonic uplift. The value of FD up to 1 Matlab algorithm and Arc GIS applications ge nerated the map for the distribution of FD by Box Counting Method. FD map is characterized by low to very low fractal value indicating high surface deformation and active tectonics. The high fractal values indicate low surface deformation due to active tectonics. North East (NE) zones of Skardu and Ghanche show high fractal values and non linear drainage patterns.
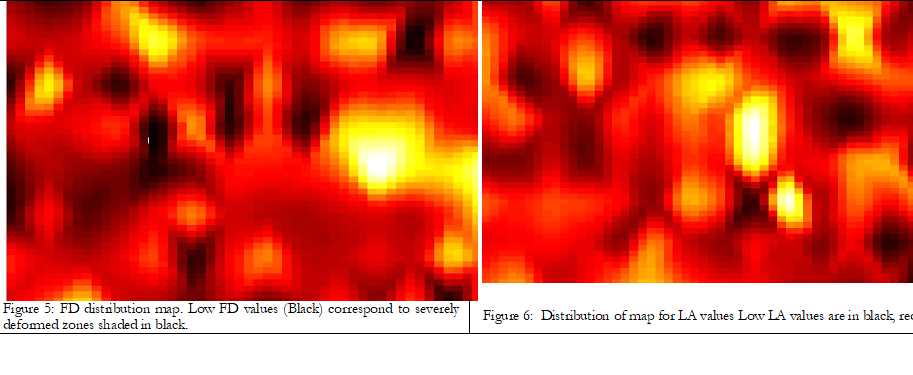
The regions exhibiting high fractal values correspond to high to medium values of LA. The GB regions have faced severe deformation due to collision of India Eurasia and current earthquake events. The surface deformation of streams and rivers due to neotectonics indicates the presence of thrusts and faults. Succolarity develops in the regions having similar fractal values of drainage network.The values of SA categorize different GB zones on the bases of structural orientation.Figure 8 indicates the topographic surface roughness of different structures using map of area under study. Presence of snow and glaciers in the western side of Hunza indicates high fractal value. Varying patterns of drainage networks result in varying FD values. Though the gaps between drainage pattern are distributed varyingly but spatial drainage network exhibit homogenous fractal values.The LA method monitors highly steep regions which are severly deformed by relative uplift. The regions deviating from the transitional behavior of patterns exhibited by drainage networks indicate high values of LA.
Surface topographic map portrays strong river incision in upper Skardu Deosai, upper Hunza, Plateau, Ghanche and Diamir-Gilgit-Astore indicating active tectonics and relative uplift along Raikot Sassi fault. The collision of Eurasian and Indian plates causes thickening of earth’s crust causing relative uplift and development of mountain chain. This process indicates incision and consequential neotectonics activity.
Conclusion
The fractal tools accurately report the spatial drainage network and topographic evolution in northern regions of Pakistan. The high LA and SA value and lower value of FD indicates high surface deformation and neotectonics activity in spatially distributed drainage networks. The fractal tools analyze the relative surface deformation accurately. The drainage network of Gilgit Baltistan displays parallel, disconnected and linear patterns of spatially distributed drainage networks in correspondence to active tectonics. The fractal tools indicated that Gilgit Baltistan is under impact of neotectonics activity and deforming severely. Increased incision in Hunza valleys, Ghizer, Ghanche and upper Skardu causes sudden variations in Gilgit Baltistan region. Exceptionally, Deosai Plateau contains less incised regions. The increased incision represents high value of surface roughness and relative uplift. Surface roughness significantly appears in Hunza fault, MKT, RSF and along Karakorum fault. Computation of surface roughness through DEM provides efficient map to indicate neotectonics activity.
Acknowledgment
The authors are thankful to remote sensing and GIS laboratories of the Space Sciences Department, university of the Punjab, Lahore, Pakistan, for providing necessary facilities and field work support.
References
- Melo, R. H. C., Conci, A., Identificação de tumours dosseios pelaanálise de suasimagens on IEncontro Nacional de Engenharia Biomecânica -ENEBI Organized by: ABCM, UFMG and IME. 2007.
- Shahzad, F. and R. Gloaguen. TecDEM: A new tool for Tectonic Geomorphology, Part2: Surface dynamics and basin analysis.Computer and Geosciences. 2010.
- Plotnick, R.E., Gardner, R.H., O'Neill, R.V., Lacunarity indices as measures of landscape texture, Landscape Ecology, Springer Netherlands, vol. 8, pp: 201-211, 1993.
- Dombradi, E., G. Timar, B. Gabor, C. Sierd and H. Frank. Fractal dimension estimations of drainage network in the CarpathianPannonian system, Global and Planetary Change, Vol 58, issue 1-4, pp :197-213, 2007.
- Dong, P..Lacunarity analysis of raster datasets and 1D, 2D. Computers and Geosciences, Vol 35, issue 10, pp: 2100-2110, 2009.
- Grohmann, C. H.,.Morphometric analysis in Geographic Information Systems: applications of free software GRASS and R., Computers & Geosciences, Vol 30, pp :1055–1067, 2004.
- Valous, N.A., D.W. Sun, P. Allen and F. Mendoza..The use of lacunarity for visual texture characterization of pre-sliced cooked pork ham surface intensities. Food Research International Vol 43, pp: 387–395, 2010.
- Mahmood, S.A., F. Shahzad and R. Gloaguen..Remote sensing analysis of quaternary deformation using river networks in Hindukush region. In: IEEE International Geosciences and Remote Sensing Symposium, Cape Town, South Africa. Pp: II-369 - II-372, 2009.
- Holschneider, M. On the wavelet transformation of fractal objects. Journal of Statistical Physics, Vol 50, issue 5, pp.963-993, 1988.
- Theiler, J., 1990. Estimating fractal dimension. JOSA A, 7(6), pp.1055-1073.
- Plotnick, R.E., Gardner, R.H. and O'Neill, R.V., Lacunarity indices as measures of landscape texture. Landscape ecology, Vol 8, issue 3, pp.201-211, 1993.
- Plotnick, R.E., Gardner, R.H., Hargrove, W.W., Prestegaard, K. and Perlmutter, M., Lacunarity analysis: a general technique for the analysis of spatial patterns. Physical review E, Vol 53, issue 5, pp:5461, 1996.
- De Melo, R.H.C. and Conci, A., Succolarity: Defining a method to calculate this fractal measure. In 2008 15th International Conference on Systems, Signals and Image Processing, pp. 291-294, 2008.
- de Melo, R.H. and Conci, A., How succolarity could be used as another fractal measure in image analysis. Telecommunication Systems, Vol 52, issue3, pp.1643-1655, 2013.
- Xia, Y., Cai, J., Perfect, E., Wei, W., Zhang, Q. and Meng, Q., 2019. Fractal dimension, lacunarity and succolarity analyses on CT images of reservoir rocks for permeability prediction. Journal of Hydrology, Vol 579, pp:124198, 2019.


