
Sentiment Classification Using Multinomial Logistic Regression on Roman Urdu Text
Irfan Qutab1, Khawar Iqbal Malik2, Hira Arooj3
1,2, Department of Computer Science, University of Lahore.
3 Department of Mathematics & Statistics, University of Lahore.
* Correspondence: Khawar Iqbal Malik, Email ID: khawar.iqbal@cs.uol.edu.pk.
Citation | Qutub. I, Malik. K. I, Arooj. H, “Sentiment Classification Using Multinomial Logistic Regression on Roman Urdu Text”. International Journal of Innovations in Science and Technology. Vol 4, Issue 2, 2022, pp: 323- 335.
Received | March 15, 2022; Revised | April 5, 2022 Accepted | April 16, 2022; Published | April 17, 2022.
________________________________________________________________________
sentiment analysis seeks to reveal textual knowledge of literary documents in which people communicate their thoughts and views on shared platforms, such as social blogs. On social blogs, users detail is available as short comments. A question of sentiment analysis has been raised by information across large dimensions published on these blogs. Although, some language libraries are established to address the problem of emotional analysis but limited work is available on Roman Urdu language because most of the comments or opinions available online are published in text-free style. The present study evaluates emotions in the comments of Roman Urdu by using a machine learning technique. This analysis was done in different stages of data collection, labeling, pre-processing, and feature extraction. In the final phase, we used the pipeline method along with Multinomial Logistic Regression for the classification of the dataset into four categories (Politics, Sports, Education and Religion). The whole dataset was divided into training and test sets. We evaluated our test set and achieved results by using Precision, Recall, Accuracy, F1 Score and Confusion Matrix and found the accuracy ranging to 94%.
Keywords: Sentiment Analysis, Emotion Analysis, Multinomial Logistics Regression, Machine Learning.
|
Author’s Contribution Khawar Iqbal Malik: Main Idea, supervisor, proof reading and corresponding author Irfan Qutab: Data collection, coding and implementation, article writing Hira Arooj: Co-supervisor, Proof reading, mathematical section support, rephrasing Muhammd Aqeel Asad: Help in Data collection |
CONFLICT OF INTEREST: The author(s) declare that the publication of this article has no conflict of interest.
|
Project details. This was thesis work of Mr. Irfan Qutab for degree MSCS Dataset & Codes: Provided on Request.
|
INTRODUCTION
Generally, social media is used to express emotions with a viewpoint for an incident or a problem. Organizations usually express their opinions and concerns regarding their products or service in the declaration [1]. This knowledge can be used by other organizations to improve and optimize their effectiveness which can be achieved through sentiment analysis. Sentiment analysis is generally known as "opinion mining," which defines emotions under a set of words to gain an understanding of anonymous thoughts, values, and sentiments. The sentiment analysis demonstrates the semantic interpretation of written texts in which people share their views on platforms and social media[2].
During recent years, Roman Urdu has been established frequently which provides people a new choice for exploring their emotions and feelings. Roman Urdu has particularly appeared as a popular language over the last few years. Thus, people have the freedom to share their thoughts in their own words. The third biggest language in the world is Urdu / Hindi[3]. Recognized English language emotional analyzers are not feasible for Urdu or Roman Urdu because of their written variants, morphology and vocabulary. In online marketing, product reviews have gained central importance[4].
Everyone wants to read the reviews first before buying anything from the online market and mostly these reviews (opinions) are written in Roman Urdu which needs to be analyzed and classified for a better understanding of customers. In general, the study of opinion can be used as a method to reflect the polarity in thought and religion[5]. Most studies are primarily based on English-language opinion surveys. This study of sentiment analysis of Urdu language or the Roman Urdu is quite limited and there is a cushion available to work in this area.
The sentiment classifier presented in this study is an attempt to fill the gap in this area which shall be helpful for the business community and will also be effective for general users and researchers of Roman Urdu. Our design process includes six steps. The first step is data collection and data labeling while the second step is the preprocessing of data. In the third step, we split the dataset for training and testing purposes and in the fourth step, we performed tokenization and feature extraction using a count vectorizer and TF-IDF (Term Frequency- Inverse Document Frequency). Next is the classification step of comments by using Multinomial Logistic Regression into four classes which are Politics, Sports, Education and Religion. The last step is about checking the validity of the model using the K-fold cross-validation method. All these steps are detailed in the methodology.
In general, this study is beneficial for identifying specific topics on social websites and the way people share their ideas and feelings, respectively in Roman Urdu. We can also perform the automatic collection of data relevant to four categories for the exploration of further studies.
This section presents an introduction to sentiment analysis and the present research. Existing and related work has been discussed in Section 2. The construction of model includes various steps which have been elaborated in Section 3. The model is tested on data and the results are evaluated accordingly and have been discussed in Section 4. Similarly, conclusion and directions for future work have been presented at the end.
RELATED WORK
Analysis of sentiments is a method in which the feelings are detected. The study of emotions, generally referred to as opinion mining, decides the feelings behind the collection of words to gain a better understanding of behaviors, views and emotions shared online[6]. Most comments/opinions online are published in free-text style. Analysis of sentiments should be used as a means of expressing the polarity of comments and views. These observations/opinions may be in different languages i.e., Arabic, Hindi, Roman Urdu, French, etc.
According to Ramadhan et al[6], there are three kinds of sentiment analysis available:
- Sentence-level: Classifies the feeling in every word, and identifies it as positive or negative if the sentence is subjective.
- Document-level: Identifies an opinion as a positive or negative view. The document is used as a simple information unit (discussing one subject).
- Aspect-level: Classifies emotions in terms of specific aspects of entities. For the different aspects of the same entity, users may give different opinions.
Three different kinds of approaches: machine learning, lexicon-based and hybrid approaches are used for sentiment classification [7] discussed as follows.
For Roman Urdu, three sentiment classifiers are existing which are based on Naïve Bays (NB), Logistic Regression (LR) and the Support Vector Machine (SVM) algorithms. In the first classifier[8], SVM performs better than the Naïve Bays and the Logistic Regression. The accuracy of SVM reached up to 87.22%. In the second classifier[9], Roman Urdu text was analyzed across five separate models. In this work, 779 reviews in the fields of drama, cinema & telefilm, online reviews, politics, etc., were collected. They used Unigram, Bigram and (Unigram + Bigram) features for this purpose. Among the five, as compared to the other three models, the performance of the LR and the NB models was higher. Additionally, overall findings were improved after the feature reduction. In the third classifier[10], a comparative study of sentiment analysis for Roman Urdu text is presented. They explained the models used in the existing work of sentiment analysis for Roman Urdu. They also compared the results that were achieved by the researchers.
A twitter-specific lexicon was created for sentiment analysis using N-grams and statistical analysis technique to select a supervised function by Gezici et al. They evaluated a theoretical[1] model using 3440 tweets from the Justin Bieber Twitter page[2] that were manually compiled and identified. The test results indicated that the model they suggested met the SVM norm and reached 95.1 percent accuracy[11]. Recently, in an automation-dependent study of emotions, different feature extraction and selection methods are discussed. It has been found that to determine the semantic position of all derived elements to calculate the complete polarities of the language, the lexicon-based approaches were paired with corpus-dependent approaches[12].
A mixed approach was used to apply details to Twitter data for the responsiveness levels study, [1] by using modified terminology. The results of the previous stage were then taken by a different classifier which was eligible to add consciousness poles to perception tweets. A sensitivity analysis has been conducted utilizing the broad collection of results[13]. They also noticed that large-grade n-gram results could be better than the distinguishing classifier listed in journals. They also established a new model for activation of ancestral neural network parameter weights using the unattended neural network. They also gained an automated recursive encoder system for studying word positioning. To improve productivity, they integrated word representations into models such as SVM or LR.
MATERIAL AND METHODS.
Our framework has been divided into six stages. Initially, we captured comments posted in Roman Urdu from a Facebook social blog by using Web Extractor Software[3] (NodeXL). To build a training set, the collected comments were recorded in plain text. The training dataset was labeled manually into 4 categories including Politics, Sports, Education and Religion. Then, we trained our model on training set after some necessary preprocessing and feature extraction of the data. To evaluate the performance of our model on different criteria including precision, recall, accuracy, f-Score and confusion matrix, we used our test dataset separated initially from the preprocessed collected comments. Process flow diagram of our model is presented in Figure 1 along with the section wise detail ahead.
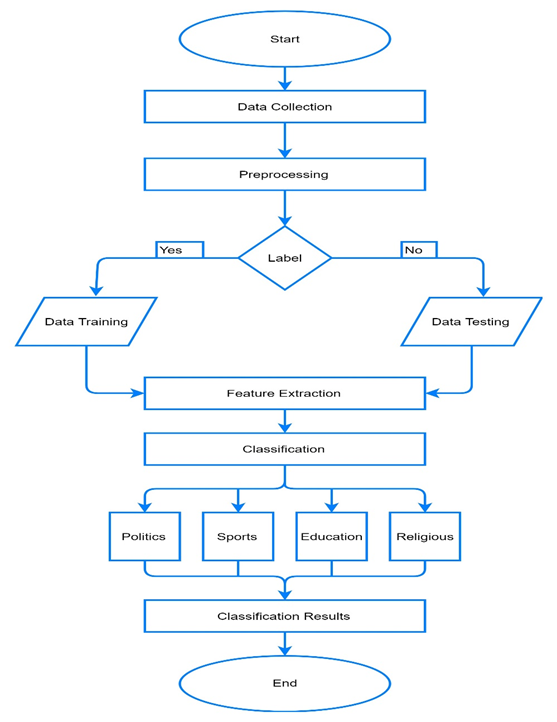
Figure 1. Methodology Sentiment Classification Using Multinomial Logistics Regression
Dataset: We used a public dataset that is available[4] for Roman Urdu. It is to be noted that the majority of the people in the subcontinent use Roman Urdu to express their ideas and feelings. However, we also collected data from Facebook to increase the size of the dataset as the publicly available dataset was small in size, statistics have been discussed next.
After collection, labeling like politics, sports, education and religion, was performed on the dataset that consists of 4065 reviews. Some example sentences in Roman Urdu are “tum kya parh rhy ho?” (What are you reading?), “Main cricket khelta hun” (I play cricket), “Babar Azam Nay century Ki” (Babar Azam scored a century), and “us nay Islam qabool kr liya” (He has embraced Islam). The labeled dataset is shown in Table 1.
Table 1. Roman Urdu Dataset
|
Count # |
Text |
Class |
|
0 |
#%@islam aik mukamal zaabta e hayyat hai ^&^% |
Religious |
|
1 |
&main cricket khelta hun*%$ |
Sports |
|
2 |
##football khelny ky liy stamina chaihiay*& |
Sports |
|
3 |
^&^%$@games sehat ky liy bohat mufeed hain |
Sports |
|
4 |
^&^2imran nazir acha batsman hai*& |
Sports |
|
….. |
…… |
….. |
|
4060 |
Pakistan ka pehla wazir e azam jo hr din aor h…… |
Politics |
|
4061 |
Greatest visionary PM according to his saying …. |
Politics |
|
4062 |
What a poor friend Pm which Pakistan has never….. |
Politics |
|
4063 |
O bhi ye page chala raha hy aisa lagta hy khan…….. |
Politics |
|
4064 |
PM sb awam itna tang achoka ka khood lkhtyatee….. |
Politics |
Preprocessing: Preprocessing is an important phase that maintains the important words and removes the unnecessary words. It excludes needless terms such as punching lines, numerical characters and stopping terms. Data preprocessing helps in minimizing the computation time and dimensions of the data. It consists of different steps which include removing stop words, data auto correction, and stemming by using NLTK library in python. After applying these steps, dataset was preprocessed which is shown in the Table 2.
Table 2. Dataset after Cleaning
|
Count # |
Text |
Class |
|
0 |
islam mukamal zaabta e hayyat |
Religious |
|
1 |
cricket khelta |
Sports |
|
2 |
football khelny stamina chaihiay |
Sports |
|
3 |
games sehat mufeed |
Sports |
|
4 |
imran nazir batsman |
Sports |
|
….. |
…… |
….. |
|
4060 |
Pakistan pehla wazir e azam din…… |
Politics |
|
4061 |
Greatest visionary according to his saying …. |
Politics |
|
4062 |
What poor friend which Pakistan has never….. |
Politics |
|
4063 |
page chala aisa lagta khan…….. |
Politics |
|
4064 |
awam itna tang achoka khood lkhtyatee….. |
Politics |
Training and Testing: In this step, dataset was split into training and testing. The split ratio is 70% for training and 30% for test data.
Pipelining: It is used to combine several estimators into one and thus simplify the cycle of machine learning. In a pipeline, a sequence of transformers (data modeling) is first implemented sequentially, and then a final estimator (ML model). The steps of the transformation were implemented which included fit ( ) and transform ( ). The final step of estimator includes fit ( ) and predict (). However, the estimator will enforce fit ( ) and doesn’t necessarily execute predict ( ). In short, pipelines are set up for the capability of fit ( )/ transform ( )/ predict () so that we can suit the whole pipeline to the training data and turn it into the test data without needing to do so with everything you do separately.
Feature Extraction: Extraction of features is a mechanism by which the data is converted into a set of features[14]. Feature is an entity in a pattern, the amount of which can be calculated by one of these attributes. The machine learning method depends heavily on its attributes, that’s why it is important to choose the objective for extracting the features. The feature-extraction was performed by Count Vectorizer and TF-IDF discussed next.Count Vectorizer: To use textual data for predictive modelling, it was required to parse the data to eliminate certain words and phrases – this method is called tokenization. To use as inputs in machine learning algorithms, such terms are then represented as integer values, or floating-point values. This method is called feature extraction or vectorization of the function. Count vectorizer is applied in Scikit-learns[5] to convert a series of text documents into a vector for word / token count. Pre-processing of text data may also be done prior to generating the vector representation. Such flexibility gives it an extremely multifaceted forum for text representation. Figure 2 illustrates that how count vectorizer converts the text into vectors.
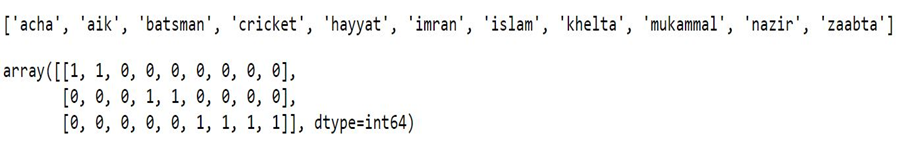
Figure 2. Vectorization by using Count Vectorizer
TF-IDF: TF-IDF Stands for “Term Frequency Inverse Document Frequency”. It shows the importance of a word to a subject in a set of documents. It is accomplished by a combination of two metrics: how many times a word is in a text; and through a set of documents to reverse the term frequency process. It has multiple applications, most importantly in predictive text processing, and is also useful for ranking terms in NLP and ML algorithms. Figure 3 represents the example of Tf-idf.
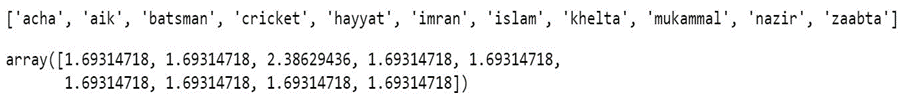
Figure 3. Feature Extraction using Tf-idf
Because the two features formulations are so comparable and hence carry almost the same detail, it's possible that employing the entire set of features (tfidf+counts) will provide higher precision. By investigating in this feature space, we might be able to get closer to the genuine model. We horizontally stack our both feature techniques by using scipy.sparse.
Logistic Regression: Logistic Regression is a binary classifier. By using Logistic Regression, data can be classified into two classes i.e., positive or negative, yes or no, mail is spam or not, etc. It is also used to measure the probability of an outcome of a binary event and to resolve classification problems. It works with dependent and independent variables. The independent variables can affect the dependent variables.
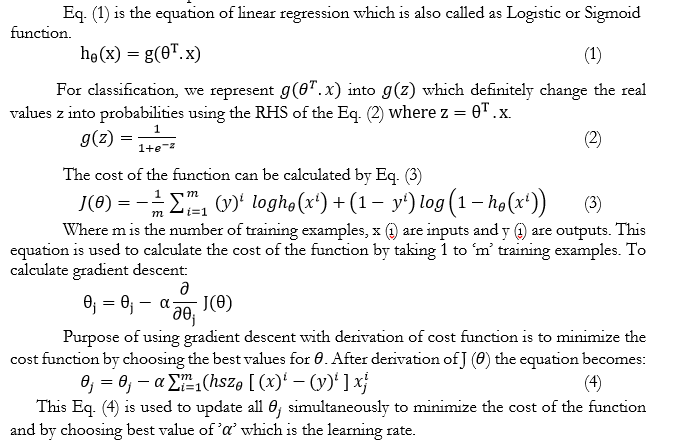
Multinomial / Multi Class Logistic Regression: Multinomial Logistics Regression (MLR) also known as Soft-max Regression is a method of classification that generalizes multiclass logistical regression i.e., with more than two distinct possible results[15]. In other words, it is a mechanism to estimate the probability of a categorically separated variable’s different potential consequences depending on an independent collection of variables. In this work, we used this algorithm for classification of data into four different classes which are Politics, Sports, Education and Religion. Previous studies classified sentiments into three categories as positive, negative and neutral, discussed in section related work. They achieved maximum 87% accuracy by using different models like SVM, NB, LR, etc. No work is done on Roman Urdu by using this model and classification categories. We used this model for classification of Roman Urdu text and our model produced better results as compared to the existing studies presented in related work
For k classes formula for MLR is given as follows:
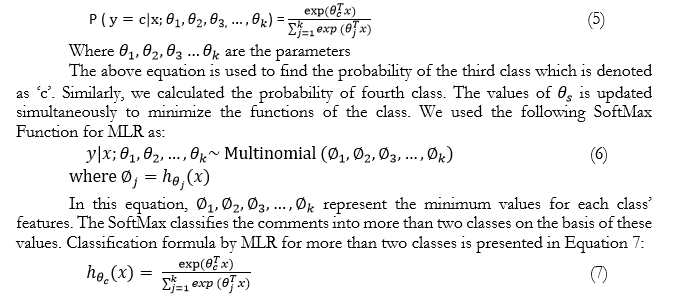
Below Figure 4 represents how classification is performed in MLR. Basically, binary classification is performed at the backend i.e., the features of one class are compared with the features of other classes to perform the process of classification.
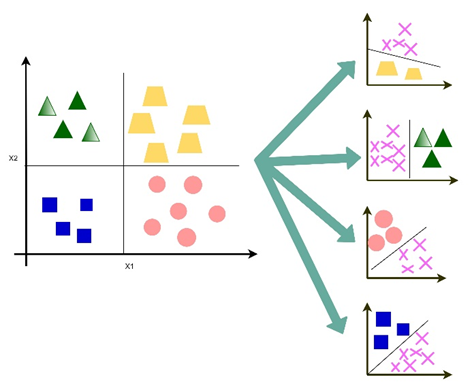
Figure 4. Classification in MLR
Precision and Recall: Precision and recall are also commonly utilized in the retrieval of details. Precision and recall are inversely proportional to each other, which makes an effective classification method necessary to explain their distinction. In a classification task, we used the following measures by equation 8 & 9:

Accuracy: Accuracy is a parameter for the measurement of classification models. Accuracy is informally the proportion of the predictions that our model accurately predicts, presented in equation 10 as follows:
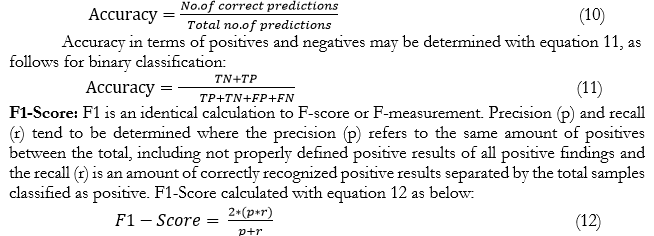
Confusion Matrix: In ML and in terms of computational classification, confusion matrix is known as an error matrix. The output of a classification (or classifier) model on the test dataset is often defined using a Table3 of ambiguities in order to distinguish specific values. This helps to understand the performance of an algorithm.
Table 3. Method to calculate confusion matrix
|
|
Predictive Positive |
Predictive Negative |
|
Actual Positive Instances |
Amount of True Positive (TP) |
Amount of True Negative (TN) |
|
Actual Negative Instances |
Amount of False Positive (FP) |
Amount of False Negative (FN) |
K-Fold Cross Validation: Cross-validation is a re-sampling technique that is used on a limited data to assess ML models. The method uses a parameter k that is the same as the number of classes subdivided for a dataset. As such, the procedure is also named k-fold cross validation. Through k-fold cross-validation, the initial data is broken improperly into a subset (fold), each with the same magnitude, and is used by k-fold to measure the system validity. The k values to assess can then be defined. Here we look at fold values between 2 and 20. According to the findings, most of k settings for this model & dataset minimize the model's performance. The findings show that k=9 is a little optimistic, but possibly more correct, estimate.
Learning Curve: To calculate the efficiency of the model, learning curves are used. The output of a training and testing data typically indicates the "risk or cost / score vs size". In case of classifiers, we can always use score or 1-score versus training & testing set size to draw the learning curves. The learning curves are useful in further iteration back to determine how much data we might need to optimally train the model.
EXPERIMENTAL RESULTS
After that preprocessing is done that includes removing stop words, data auto correction and stemming. The data collection is then split into two sections for training and testing, with 70% for training and 30% for testing. Tf-idf and Count Vectorization with pipelining method is used to extract-features and tokenization. After these steps Classification is performed by Multinomial Logistic Regression and achieved the highest accuracy of 94%. The K-Fold cross validation approach is used to track the validity of the pattern. The test is broken into 9 folds in the first study. The most effective format of the first edition is the data used in the Multinomial Logistic Regression model. The fold is checked in order to maintain the best accuracy, precision and recall across the study. For the second study, the fold value is modified to 2 and 20. By adjusting the fold value k=9, the effects have no impact.
Classification Results Using MLR: After designing Multinomial Logistic Regression (MLR) and other measures discussed in Section 3, our model was able to classify the test data into four classes which are Politics, Sports, Education and Religion. The model has obtained the highest accuracy of 94% as shown in Table 4.
Support is the number of actual occurrences for a specific class here. Macro-average and weighted average shows the overall performance of the system for the given dataset.
Table 4. Test Results Using MLR
|
Test Accuracy: 0.941830278688245 Test Report |
||||
|
|
Precision |
Recall |
F1-Score |
Support |
|
Politics |
0.93 |
0.95 |
0.94 |
404 |
|
Sports |
0.94 |
0.96 |
0.95 |
344 |
|
Education |
0.92 |
0.91 |
0.92 |
255 |
|
Religious |
0.98 |
0.93 |
0.96 |
217 |
|
|
||||
|
accuracy |
|
|
0.94 |
1220 |
|
Macro avg |
0.94 |
0.94 |
0.94 |
1220 |
|
Weighted avg |
0.94 |
0.94 |
0.94 |
1220 |
Testing Unlabeled Data: In this step, unlabeled data, as shown in Figure 8, was given to the classifier to predict that from which class the current comment belongs. This result was saved into a file named as classified. It has been found that our developed model made sufficiently correct decision in all given test cases. Unlabeled and labeled data after our testing is shown below in Figure 5a and Figure 5b.
|
|
|


Figure 5. (a-left) Unlabeled Dataset, (b-right) Labeled Dataset
Confusion Matrix: The performance of MLR is shown in the Figure 6. Diagonal values are the TPs i.e. (correct predications) here that were predicted by the model and other values correspond to TNs, FNs and FPs accordingly.

Figure 6. Confusion Matrix
Testing Scenario: As k-fold is used in cross-validation, the analysis was divided into 9-fold in the first evaluation. The data used is the most suitable composition of the first one for MLR system. Through this validation, it ensures more than 90% precision and more than 70% recall and F1-Score as depicted in Figure 7.
The value of fold is modified by 2-20 folds in the second analysis to analyze the performance of MLR. Nevertheless, changing fold doesn’t impact results.

Figure 7. Result dependent on K-fold numbers
CONCLUSIONS
Sentiment analysis of Roman Urdu text is classified into four classes which are not addressed in existing studies up to this work. Further, Multinomial Logistics Regression is used in our work which performed better than the Linear Logistic Regression practiced in existing studies for Roman Urdu. The aim and use of this research is to find the number of people who share their opinions about politics, and number of comment on sports, the ratio of those people who give their reviews about religious talks and the number of persons who comment on social media for education purposes? In our work, MLR attained the highest accuracy of 94% with our proposed classification. Results were supported with the k-fold cross validation, confusion matrix and the learning curve. This work also describes the average of people on the social media who comment on Politics, Sports, Education and Religion. Ratio for the sentiments of Politics class can be calculated whether the comments are positive or negative. This is also true for the other three classes Sports, Education and Religion. Additional classes can also be introduced in future studies.
REFRENCES
[1] L. Zhang, R. Ghosh, M. Dekhil, M. Hsu, and B. Liu, “Combining lexicon-based and learning-based methods for twitter sentiment analysis,” HP Lab. Tech. Rep., 2011. 89, 2011.
[2] G. Z. Nargis and N. Jamil, “Generating an Emotion Ontology for Roman Urdu Text,” Int. J. Comput. Linguist. Res., vol. 7 no. 3, p. 83-91, 2016.
[3] A. Rafique, M. Kamran Malik, Z. Nawaz, F. Bukhari, and A. Hussain Jalbani, “Sentiment Analysis for Roman Urdu,” Mehran Univ. Res. J. Eng. Technol., vol. 38, no. 2, pp. 463–470, Apr. 2019, doi: 10.22581/MUET1982.1902.20.
[4] E. Dogan and B. Kaya, “Deep Learning Based Sentiment Analysis and Text Summarization in Social Networks,” 2019 Int. Conf. Artif. Intell. Data Process. Symp. IDAP 2019, Sep. 2019, doi: 10.1109/IDAP.2019.8875879.
[5] I. U. Khan et al., “A Review of Urdu Sentiment Analysis with Multilingual Perspective: A Case of Urdu and Roman Urdu Language,” Comput. 2022, Vol. 11, Page 3, vol. 11, Issue. 1, p. 3, Dec. 2021, doi: 10.3390/COMPUTERS11010003.
[6] W. P. Ramadhan, A. Novianty, and C. Setianingsih, “Sentiment analysis using multinomial logistic regression,” ICCREC 2017 - 2017 Int. Conf. Control. Electron. Renew. Energy, Commun. Proc., vol. 2017-January, pp. 46–49, Dec. 2017, doi: 10.1109/ICCEREC.2017.8226700.
[7] A. D’Andrea, F. Ferri, P. Grifoni, and T. Guzzo, “Approaches, Tools and Applications for Sentiment Analysis Implementation,” Int. J. Comput. Appl., vol. 125, issue. 3, pp. 26–33, Sep. 2015, doi: 10.5120/IJCA2015905866.
[8] N. Zainuddin and A. Selamat, “Sentiment analysis using Support Vector Machine,” I4CT 2014 - 1st Int. Conf. Comput. Commun. Control Technol. Proc., pp. 333–337, Sep. 2014, doi: 10.1109/I4CT.2014.6914200.
[9] K. Mehmood, D. Essam, and K. Shafi, Sentiment analysis system for Roman Urdu, vol. 858, issue. June PP:29-42. Springer International Publishing, 2019.
[10] I. Qutab, I. Khawar, ; Malik, and H. Arooj, “Sentiment Analysis for Roman Urdu Text over Social Media, a Comparative Study,” IJCSN-International J. Comput. Sci. Netw., vol. 9, issue. 5 PP:217-224, Oct. 2020, doi: 10.48550/arxiv.2010.16408.
[11] Ankit and N. Saleena, “An Ensemble Classification System for Twitter Sentiment Analysis,” Procedia Comput. Sci., vol. 132, issue. Iccids, pp. 937–946, 2018, doi: 10.1016/j.procs.2018.05.109.
[12] B. Agarwal and N. Mittal, “Prominent Feature Extraction for Sentiment Analysis,” 2016, doi: 10.1007/978-3-319-25343-5.
[13] A. Severyn and A. Moschitti, “Twitter Sentiment Analysis with deep convolutional neural networks,” SIGIR 2015 - Proc. 38th Int. ACM SIGIR Conf. Res. Dev. Inf. Retr., pp. 959–962, Aug. 2015, doi: 10.1145/2766462.2767830.
[14] W. B. Croft, D. Metzler and T. Strohman, “Searcssh Engines information retrieval in practice,” Int. J. Inf. Manage., vol. 9, issue. 1, pp. 66–68, 1989, doi: 10.1016/0268-4012(89)90040-6.
[15] V. Vryniotis “Machine Learning Tutorial: The Multinomial Logistic Regression (Softmax Regression).” https://blog.datumbox.com/machine-learning-tutorial-the-multinomial-logistic-regression-softmax-regression/.
[1] https://academic.oup.com/bjps/article-abstract/XVI/62/102/1473834?redirectedFrom=PDF
[2] https://twitter.com/justinbieber?ref_src=twsrc%5Egoogle%7Ctwcamp%5Eserp%7Ctwgr%5Eauthor
[3] https://www.smrfoundation.org/nodexl/


