
Temporal Variations in Ice Cap of Antarctica and Greenland
Abdul Baqi1, Ali Abbas2
1Goverment Degree College Usta Muhammad, District Jaffarabad, Balochistan, Pakistan.
2 Department of Geography, University of the Punjab
Correspondence: Abdul Bai, Baqiabdul123@gmail.com
Citation |Baqi.A, Abbas. A “Temporal Variations in Ice Cap of Antarctica and Greenland ”. International Journal of Innovations in Science & Technology, Vol 03 Issue 02: pp 52-58, 2021.
Received |March 19, 2021; Revised | March April 04, 2021; Accepted | April 08, 2021; Published | April 10, 2021.
_______________________________________________________________________
Abstract
The Antarctic and Greenland polar ice caps are the largest mass of ice in world. Globally the climate system is considerably affected by these ice sheets. Several natural and anthropogenic activities have affected the balance of mass of ice sheets. Ice sheets mass loss is a consequence of changes of patterns of precipitation, changing wind patterns, increasing global temperature and increased glacial flow. Nearly 75% of the ice mass loss has been observed in these regions since last ten years. A sharp increase in ice mass loss in Antarctic and Greenland regions are detected through 0.3mm increase in sea level per year. In this research paper Satellite remote sensing techniques including Enhanced Thematic Mapper Plus (ETM+) is used to monitor and reveal the patterns of ice melt and glacier flow in these regions.
Keywords: Antarctic ice sheet; Greenland ice sheet; snowmelt; dynamic monitoring; characteristics
Introduction
The global climate system is considerably affected by the world’s largest ice sheets, the Antarctic and Greenland ice caps. The climate changes over a fraction of Antarctic and Greenland ice sheets has caused variations in snow water content which changes the reflectivity of surface of ice sheets, which disrupts balance of ice sheets in polar regions. Thus, the snowmelt in Polar Regions is of great significance for understanding the variations in global climate [1].
Antarctic and Greenland ice sheets have started losing mass since 1990 consequently raising the sea level. The loss of mass in Antarctic region has been increased thrice while the mass loss has been increased twice in Greenland from the years 2007 to 2016 [2]. One third of the total sea level has been raised since 1990 due to melting of polar ice caps [3].
Snow melts in Antarctic and Greenland ice caps are sensitive climate change indicators as these regions contain two third of the worlds fresh water in the form of ice sheets. Melting of these ice sheets will raise the level of water triggering the coastal resettlements globally. Since 1990s sea level has been raised up to 7.4mm globally as a consequence of snowmelt [4].
The ultimate dynamics of snowmelts can be measured, monitored and assessed using satellite based observations. The ice melt surfaces reflect microwave radiations which can be effectively transmitted through clouds, thus snowmelt data can be effectively detected by satellites even in the presence of clouds. Variations in snowmelt, ice mass, snowfall, glacier flow and snow density is effectively detected by microwave brightness temperature (MBT) [5,6].
Thus space borne satellites can be used to monitor ice cap changes utilizing microwave brightness temperature. Satellite capabilities to monitor physical features and assessment of variations over these features have been enhanced since last 2 decades. Remotely sensed satellite imagery is being accurately used these days in order to obtain spatio- temporal data and assessment of variance in physical attributes of Earth [7,8,9].
Material and Methods
Study Area
The area under study includes Antarctic and Greenland ice sheets. Antarctica is the largest ice mass covering 98% of the Antarctic continent. It covers 5.4 million square miles area of world while Greenland ice sheet covers 1710000km2 area of world and almost 79% region of Greenland.
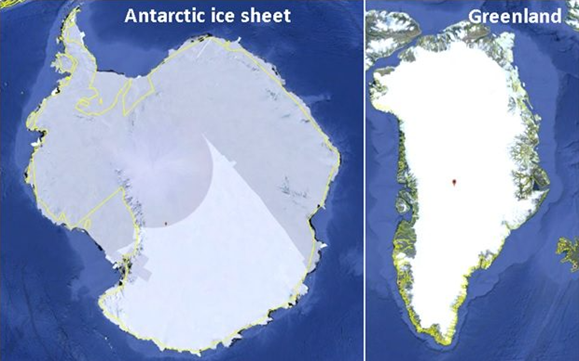
Figure 1: Antarctic and Greenland ice sheets.
Data Used
The datasets used in this research paper are obtained through spatio temporal satellite imagery and Atmospheric Infrared Sounder (AIRS) technology. The datasets were developed using microwave brightness temperature to monitor changes in ice cap [10,11].
Satellite imagery
The satellite images are obtained through Sentinel (https://sentinel.esa.int/) and Landsat (https://landsat.usgs.gov/) platform and from different sensors for instance Enhanced Thematic Mapper Plus (ETM+), including Thematic Mapper (TM), and Multi Spectral Instrument (MSI) [12,13,14].
Optical images
ENVI software was used to preprocess the acquired optical images. The images were first geo refrenced with the help JICA topographic data and GPS field surveys in accordance with the World Geodetic System the UTM projection [15]. Subsequently the images were processed for radiometric and geometric correction and then for re sampling. The atmospheric effects were reduced using radiometric correction, while the geometric correction removed the geometric distortion [17].
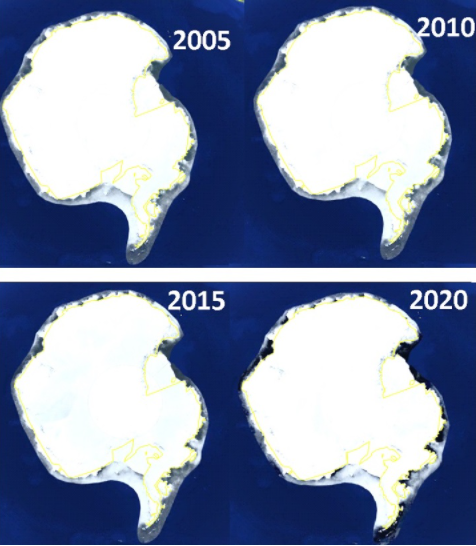
Figure 2: ice sheets of Antarctica for the years 2005, 2010, 2015 and 2020.
Figure 2 shows the satellite imagery of the Antarctic continent for the years 2005,2010,2015 and 2020. The ice mass loss since 2005 to 2020 can be observed.
Results and discussion
The climate changes over a fraction of Antarctic and Greenland ice sheets has caused variations in snow water content which changes the reflectivity of surface of ice sheets, which disrupts balance of ice sheets in polar regions. The loss of mass in Antarctic region has been increased thrice while the mass loss has been increased twice in Greenland from the years 2007 to 2016. One third of the total sea level has been raised since 1990 due to melting of polar ice caps. Since 1990s sea level has been raised up to 7.4mm globally as a consequence of snowmelt.
Figure 3. Graphical representation of ice mass loss for the year 2010 in Antarctica. The figure 3 shows that the in the year 2010 Antarctic region lost up to -730 gigatons of ice mass. The average mass loss reached to 125 gigatons per year. According to NASA the net loss of ice mass in Antarctica increased from 112 to 196 gigatons from the year 1996 to 2006. The sea level rises up to 0.35 mm per year due to this ice mass loss. Figure 4: Graphical representation of ice mass loss in the Greenland for the year 2016.
Figure 4 shows mass loss in Greenland was up to -3748gigtons by the year 2016. The average rate of ice loss in Greenland is 281 gigatons per year. According to NASA sea level raises up to 0.03 inches per year due to this ice loss. The Greenland ice sheets were gaining ice mass until 1970s, but the ice mass became decreasing since 1980s by increasing global temperature. Since 19th centaury the average 1.2°C temperature rise has affected the ice sheets in Polar Regions. Temperature rise triggered melting of snow, development of glacial lakes, changed wind and tidal patterns and raised water level of sea. The total Antarctic snow melt extent decreased by 2488.44 ± 7131.63 km2/year, and the snowmelt index decreased by 279900.54 ± 238729.96 day*km2/year from the year 1978 to 2014 while the snow melt extent of the Greenland ice sheet is less than that of Antarctica, and the average area affected was 764,000 km2 for 1978–2014.
Conclusion
In this research paper Antarctica and Greenland ice sheets have been analyzed using remotely sensed satellite data to monitor the loss of ice mass since 1990s. The results showed that these regions were gaining ice mass till 1970 later on the ice mass was lost due to increasing global temperature. Average 1.2°C rise in temperature has triggered climatic changes globally. According to NASA the net loss of ice mass in Antarctica increased from 112 to 196 gigatons from the year 1996 to 2006 while the average rate of ice loss in Greenland is 281 gigatons per year.
References
- Meier, F. Ice, Climate and sea level. Do we know what is happening? In Ice in The Climate System; Peltier, W.R., Ed.; Springer Link: Berlin/Heidelberg, Germany, pp. 141–160, 1993.
- Liu, H.; Wang, ; Jezek, K. Wavelet-transform based edge detection approach to derivation of snowmelt onset, end and duration from satellite passive microwave measurements. Int. J. Remote Sens. Vol 26, pp: 4639–4660, 2005.
- Haggerty, A.; Curry, J.A. Variability of sea ice emissivity estimated from airborne passive microwave measurements during FIRE SHEBA. J. Geophys. Res. Atmos. Vol 106, pp; 15265–15277, 2001.
- Lee, S.-M.; Sohn, B.-J. Retrieving the refractive index, emissivity, and surface temperature of polar sea ice from 6.9 GHz microwave measurements: A theoretical development. J. Geophys. Res. Atmos. Vol 120, pp: 2293–2305, 2015.
- Skofronick-Jackson, M.; Gasiewski, A.J.; Wang, J.R. Influence of microphysical cloud parameterizations on microwave brightness temperatures. IEEE Trans. Geosci. Remote Sens. Vol 40, pp: 187–196, 2002.
- Zwally, J.; Gloersen, P. Passive microwave images of polar regions and research applications. Polar Rec. Vol 18, pp: 431–450, 1977.
- Ulaby, T.; Moore, R.K.; Fung, A. Microwave Remote Sensing: Active and Passive; From theory to application; Artech House: Norwood, MA, USA, Vol 3, 1986.
- Mote, L.; Anderson, M.R.; Kuivenen, K.C.; Rowe, C.M. Passive microwave-derived spatial and temporal variations of summer melt on Greenland ice sheet. Ann. Glaciol. Vol 17, pp: 233–238, 1993.
- Zwally, J.; Fiegles, S. Extent and duration of Antarctic surface melting. J. Glaciol. Vol 40, pp: 463–476, 1994.
- Steffen, ; Abdalati, W.; Stroeve, J. Climate sensitivity studies of the Greenland ice sheet using satellite AVHRR, SMMR, SSM/I and in situ data. Meteorol. Atmos. Phys. Vol 51, pp: 239–258, 1993.
- Abdalati, ; Steffen, K. Greenland Ice Sheet melt extent: 1979–1999. J. Geophys. Res. Vol 106, pp; 33983–33988, 2001.
- Takala, ; Pulliainen, J.; Huttunen, M.; Hallikainen, M. Estimation of the beginning of snow melt period using SSM/I data. In Proceedings of the IEEE International Geoscience and Remote Sensing Symposium 2003 (IGARSS), Toulouse, France, 21–25 July 2003.
- Joshi, ; Merry, C.J.; Jezek, K.C.; Bolzan, J.F. An edge detection technique to estimate melt duration, season and melt extent on the Greenland ice sheet using passive microwave data. Geophys. Res. Lett. Vol 28, pp; 3497–3500, 2001.
- Liu, H.; Wang, ; Jezek, K. Spatio-temporal variations of snow melt zones in Antarctic Ice Sheet derived from satellite SMMR and SSM/I data (1978-2004). J. Geophys. Res. , Vol 111, 2006.
- Aschraft, S.; Long, D.G. Comparison of methods for melt detection over Greenland using active and passive microwave measurements. Int. J. Remote Sens. Vol 27, pp: 2469–2488, 2007.
- Torinesi, ; Fily, M.; Genthon, C. Variability and trends of the summer melt period of Antarctic Ice margins since 1980 from Microwave sensors. J. Clim. Vol 16, pp: 1047–1060, 2003.
- Tedesco, Assessment and development of snowmelt retrieval algorithms over Antarctica from K-band spaceborne brightness temperature (1979–2008). Remote Sens. Environ. Vol 113, pp: 979–997, 2009.


