
Evaluation of LNG consumption in local market through GIS
Keywords:
LNG, GDP, Economic growth, interpolation, LNG distribution points.Abstract
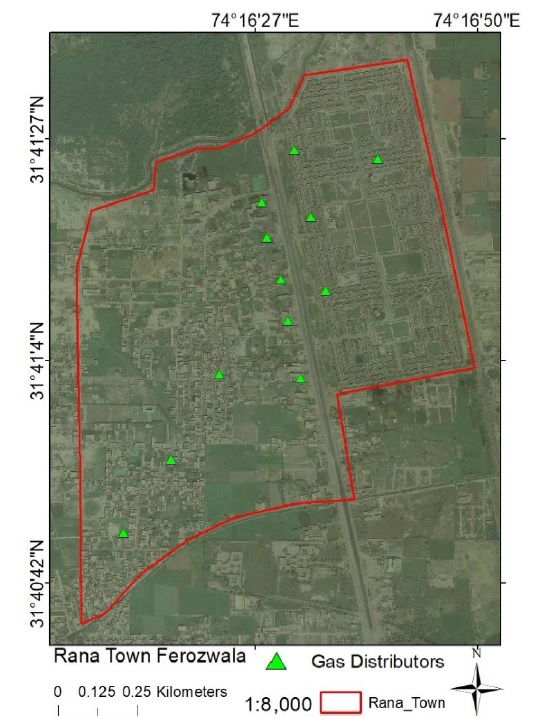
Liquified natural gas (LNG) has become a basic energy source which is mainly used to run industrial wheel. It has played a vital role for boosting economic growth/GDP of Pakistan. Most of power plants and industries use LNG for generation of commodities of domestic use. The contribution of LNG in the total energy supply is 38% which increases up to 40% in winter. This research was conducted in Rana Town Ferozwala. We selected this area because of non-availability of Sui Northern or Southern network of gas pipelines. We used spatial interpolation technique to map the sale of LNG at various sale points throughout the year 2017. We observed the maximum sale of LNG during winter season (Nov-April) where the LNG demands exceeded from 13.2 tons as compared to the normal 8 tons. It was observed that the LNG demand was declined below the approximated demand e.g., a very less amount of LNG was consumed during June and July which was (2.7-6.9) tons and (2.9-6.7) tons respectively that must be more than 8 tons. On field observation we found that most of people prefer the usage of biofuel instead of LNG in summer season because there is excess of dry residue of animals and the dry wood as well for cooking. This trend analysis determines the LNG consumption across a region where interpolation technique proved efficient in public trend mapping for purchase of LNG during 2017.
Published
How to Cite
Issue
Section
License
Copyright (c) 2019 50Sea

This work is licensed under a Creative Commons Attribution 4.0 International License.


